
“Great communication and follow up.”
T
terry i
Loan Officer at NMLS# 17022
Mortgage rates are moving mostly sideways this week, but with a slight upward bias.
Alright, people... This week could get interesting.
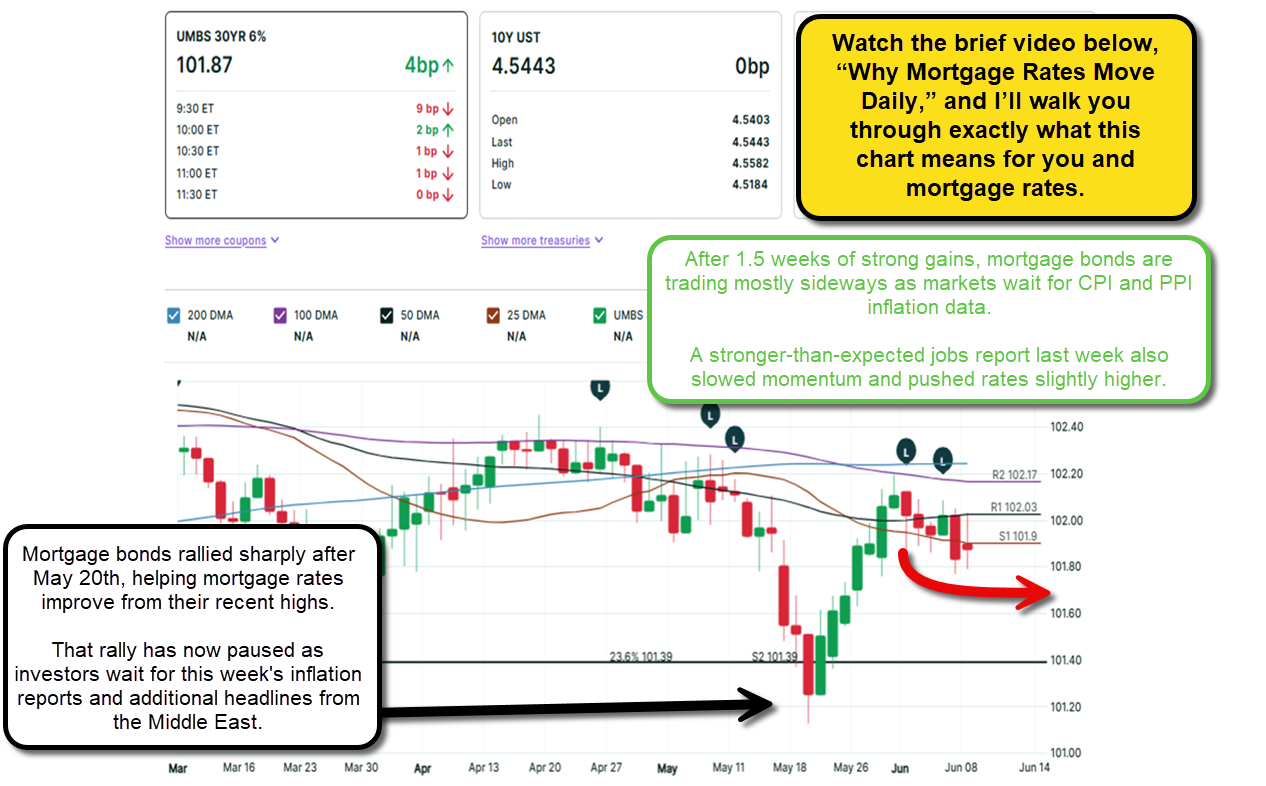
After a strong jobs report pushed mortgage rates slightly higher late last week, the market is now turning its full attention to inflation.
This week's Consumer Price Index (CPI) and Producer Price Index (PPI) reports will give investors a better idea of whether inflation is finally cooling off or still refusing to cooperate.
At the same time, markets continue to watch developments in the Middle East as negotiations with Iran progress. Any major headlines could quickly impact oil prices, inflation expectations, and ultimately mortgage rates.
Friday's jobs report came in stronger than expected.
➡️ Job growth beat forecasts
➡️ The labor market continues showing resilience
➡️ Mortgage bonds sold off after the report
➡️ Mortgage rates moved slightly higher
The good news is that rates have only given back a small portion of the improvement we saw during the strong bond rally over the past two weeks.
This week's biggest events include:
➡️ ADP Employment Report
➡️ Consumer Price Index (CPI)
➡️ Producer Price Index (PPI)
➡️ Ongoing developments with Iran and the Middle East
If inflation comes in lower than expected, mortgage bonds could find support, helping rates improve.
If inflation comes in hotter than expected, rates could face additional pressure.
Housing continues to show surprising resilience despite affordability challenges.
Inventory is slowly improving, buyers are still active, and home values continue holding up much better than many expected.
The biggest challenge remains affordability, which is why inflation and interest rates remain the market's primary focus.
Mortgage rates have pulled back slightly after a strong two-week rally, but the bigger trend this week will likely be determined by inflation.
The market is basically sitting at the table waiting for the CPI report to arrive before deciding what to do next.
And right now, Wall Street's attitude seems to be:
Sometimes you just have to laugh a little and roll with the market. It will stabilize soon enough...
Below you’ll find the National Average Mortgage Rates as published for industry reference. These rates are for illustration only and reflect recently closed loans, not current market rates. Use this only for a general trend indicator. Your actual rate will depend on your financial profile and local market conditions, which is why getting pre-approved before you start shopping is key.
Source: Optimal Blue Mortgage Market Indices (OBMMI). Indices reflect aggregate rate lock data. Learn more.
The market moves fast. These two updates give you the clarity to stay ahead, so you can make confident, well-timed decisions, whether you’re buying, selling, or waiting.
If you have any questions or need more information about our affordable home financing solutions, please don’t hesitate to CONTACT ME. My team and I are here to help you every step of the way!
Ready to start your home journey? Click here to submit your loan application today!
Best regards,
Michael Thayer, CMPS, CMA
NMLS #173264
Mortgage rates change every day, but most people don’t understand why… Or what it actually means for them. This page (updated weekly) is designed to simplify everything. In this video, you’ll learn:
Whether you're:
This resource helps you stay ahead of the market and make more confident decisions. You’ll also find:
Bookmark this page and check back weekly to stay informed.
Have questions or want a breakdown for your local market? Reach out, I am happy to help.
Why Rates Move Daily:
Alright, before we get into this, let me be very clear: if anyone is telling you mortgage rates move for some random reason or pointing to anything other than what I’m about to explain, they’re wrong, you’re talking to the wrong person. Mortgage rates are driven by two core factors: inflation and the economic data that impacts it, and more specifically, how those factors influence the way mortgage bonds trade on Wall Street. That’s what ultimately drives the rates you and I see every day, and it really is that simple. Some people point to the 10-year Treasury as an indicator, and while it can be helpful, it doesn’t always tell the full story and can be misleading at times. Most people can’t explain this clearly, and that’s why this exists: to break it down simply so you finally have clarity. It can feel confusing because it’s counterintuitive, but once you understand that it works in the opposite way you might expect, it becomes much easier. Think of it like a teeter-totter: when one side goes up, the other side comes down, and that’s exactly how mortgage bonds and mortgage rates behave. What you’re looking at in a bond chart is daily movements shown as candlesticks; each bar represents one full day of trading. Green is good, meaning bonds improved and rates typically move lower; red is bad, meaning bonds declined and rates move higher. Now tie that back to the teeter-totter. When bond yields improve, rates get better; when bond yields decline, rates get worse. The biggest factor influencing all of this is inflation, because inflation erodes the value of bonds over time. When inflation rises or is expected to rise, bonds struggle, and when bonds struggle, mortgage rates increase. When inflation cools, bonds improve, and rates can move lower. So if you’re watching one thing, watch inflation; it’s the key driver. If inflation comes in higher than expected, expect rates to rise; if it cools, rates can improve. The good news is you don’t have to figure this out on your own. I break this down and update it every week, so you can understand the trend, see what’s happening, and make better decisions. Most people fear what they don’t understand, and that costs them money, but when you have clarity, you make stronger, more confident decisions. Use this as your resource, come back to it, and if you have questions, reach out. I’m here to help make sense of it all.
“Great communication and follow up.”
“Not only is Michael extremely knowledgeable, it seems he has the heart of a teacher. While the subject is extremely complex, he was able to educate me on the key aspects of the process and to make me feel comfortable that I understood what I was taking in.”
“loan was approaved in record time. responsive and flexible.”
“Michael Thayer is one of the best in Nashville, if not one of the best in the nation. Professional, honest and on time every time.”
“Michael's communication regarding every phase of the loan process was absolutely phenomenal and the transaction even closed a whole week early! I was super impressed. Everything was exceptionally well done! Thank you so much.”
“Thanks Michael”
“The team at Guild were attentive and proactive throughout the homebuying process, making for a stress-free purchase for us as first-time home buyers.”
“We really enjoyed working with Guild Mortgage. Everyone was so knowledgeable, kind, professional, and patient. It is clear that the entire team cares about their work and making sure their customers have a great experience.”
“Transaction went smoothly and Michael kept all parties informed of progress.”