What If Asking For A Price Cut Was The Wrong Strategy?
Which Is The Better Question To Ask?
Most buyers ask:
➡️ How Much Can I Get Off The List Price?
But often the better question is:
➡️ How Much Can We Improve The Monthly Payment?
Because buyers don't live with the list price... They live with the monthly payment.
See What The Numbers Actually Show
Explore a real-world example comparing different affordability strategies and their impact on:
➡️ Monthly Payment
➡️ Cash Needed To Close
➡️ Long-Term Cost
Sometimes The Numbers Tell A Very Different Story Than Most Buyers Expect
Sometimes The Numbers Tell A Very Different Story Than Most Buyers Expect
Compare The Impact Of This Strategy For Yourself
Use the calculator below to compare how different affordability strategies may impact:
➡️ Monthly Payment
➡️ Cash Needed To Close
➡️ Overall Buying Power
Let's start with the listing price and how much you're putting down.
Next, here are some payment and savings estimations based on the change in rate.
There is a cost to change the rate from % to % and it can be offset by a seller credit.
With a rate of %, the estimated monthly payment is , a savings of $ a month. If your rate was %, with a payment of , that's like buying a house for . The change in rate has increased your buying power by to .
Here are some example options for a purchase with a list price, % down, and a rate reduction from % to %.
Apply the savings wherever life needs it.
That's more home for the same monthly payment.
Figures shown are estimates for illustration and do not include taxes, insurance, or fees. Actual rates, payments, and costs vary by lender.
The Difference Is Often Bigger Than Buyers Expect
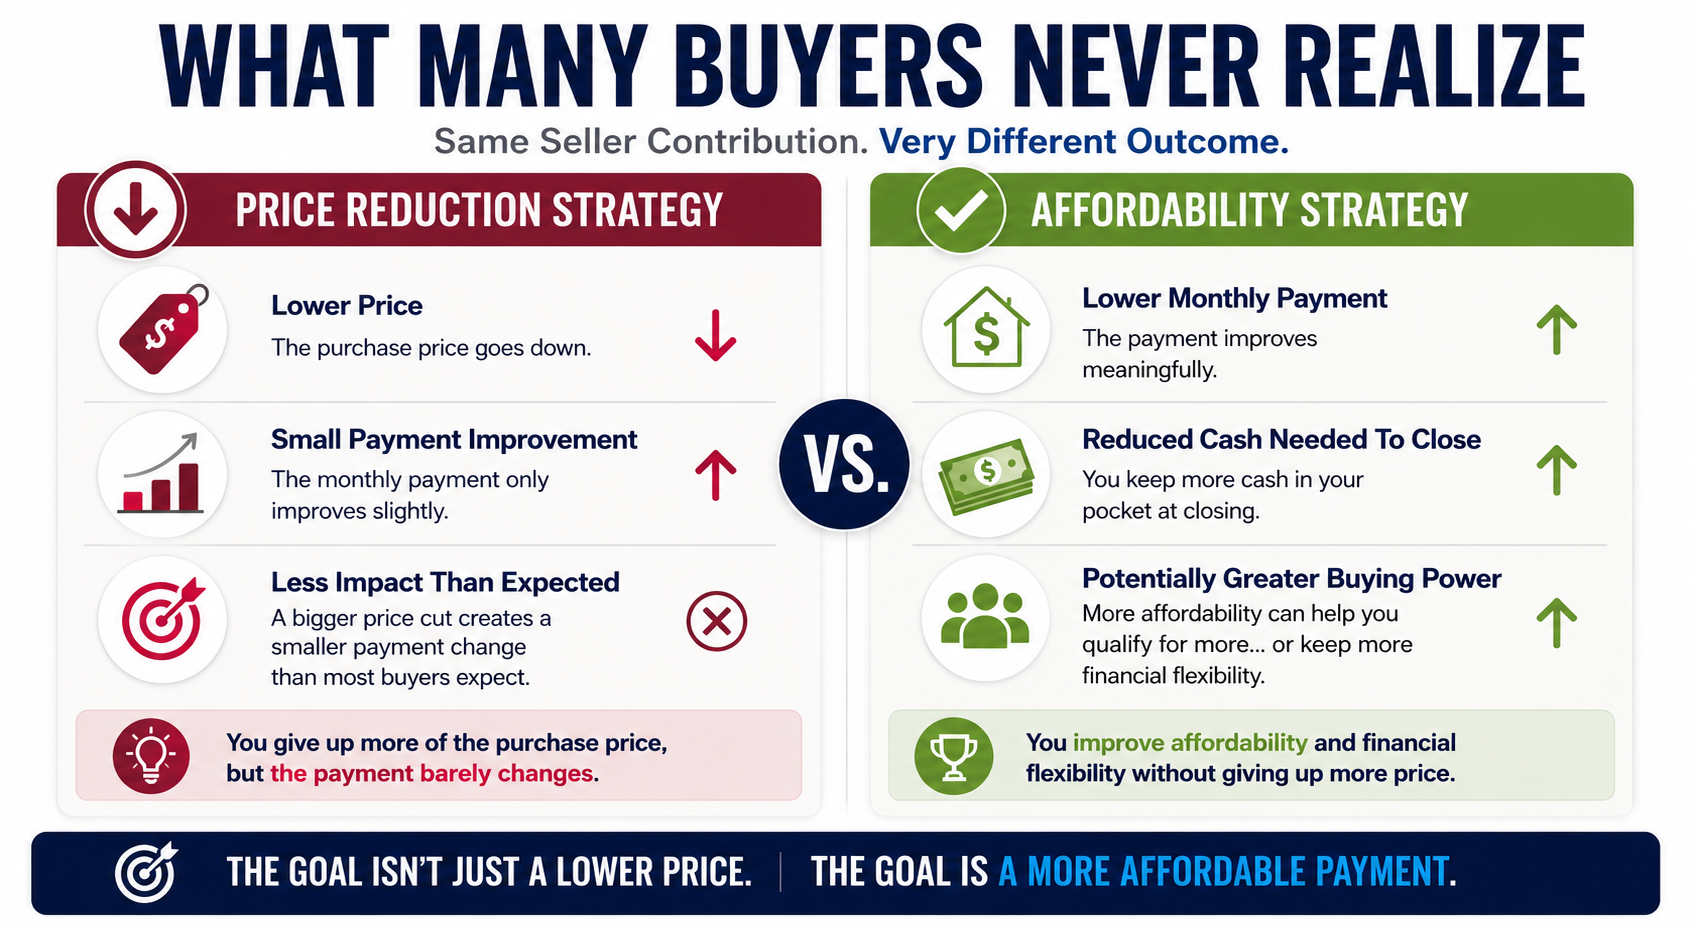
The Difference Is Often Bigger Than Buyers Expect
We Believe Buyers Deserve More Than A Rate Quote
➡️ More Clarity... More Strategy... More Confidence
Because buying a home isn't just about getting approved.
It's about understanding your options...
Don’t Have Anything Saved For A Down Payment?
➡️ Click here to Explore Down Payment Assistance Options
Then reach out to your agent to schedule a showing and contact me, or schedule a call to explore how this strategy could work for you.
Making informed decisions and building a strategy around your goals.
That's exactly what we're here to help you do.
Best regards,
Michael Thayer, CMPS, CMA
NMLS #173264
Planet Home Lending, NMLS #17022
Explore Buyer & Seller Resources & Next Steps
+ −Market Timing vs. Market Strategy: When Is the Right Time to Buy... And More Importantly, Why?
Calculators & Loan Programs Questions Answered: Mortgage Programs & Financing Calculator
Smart Financing Strategies to Lower Your Monthly Mortgage Payment: Smart Mortgage Strategies & Financing Hacks
Homebuying Roadmap: Your Mortgage GPS
Moving To Middle Tennessee: Moving To Middle Tennessee Resource Center
Search Open Houses: View All Middle Tennessee Open Houses
Main Resource Hub: Buyers, Sellers, Realtors, and Builders Resources and Strategies
Additional Information & Reference Guides
+ −Video Transcript
+ −Video Transcript
00:00
What if asking for a price cut was actually the wrong strategy?
00:07
Because here's what many buyers don't realize.
00:10
A small reduction in the purchase price.
00:13
Only creates a very small change with your actual monthly payment.
00:18
And in today's market, The monthly payment
00:21
Is what most buyers actually feel.
00:24
My name is Michael Thayer, I'm a mortgage advisor based in Nashville, Tennessee, serving clients nationwide. And one of the biggest… I mean, one of the biggest misconceptions that many buyers have, still, today, is thinking.
00:38
One way.
00:39
to create affordability.
00:41
And that's negotiating the lowest possible price.
00:45
But sometimes?
00:47
Strategically using seller concessions for permanent interest rate buy-downs and to reduce your cash to close creates significantly more affordability instead of a lower price, meaning
01:00
You may not need.
01:02
That significant price reduction many buyers think they need to achieve the monthly payment that you're actually looking for. And even some buyers walk away from homes, believe it, they're not affordable, without exploring how different financing strategies could change the payment structure significantly.
01:19
And that's where things start to get very interesting, people. Because if you like this house, but the payment feels too high.
01:27
We provide financing strategies that can dramatically change the numbers for you. That's exactly why I built this page.
01:34
Below this video, you're gonna see side-by-side payment comparisons that illustrate the interest savings, the affordability calculators, the future appreciation projections for this house, and interactive tools to explore the numbers yourself. Because sometimes.
01:50
The smartest opportunities are not just about negotiating the lowest price.
01:55
It's about understanding.
01:56
the strategy around an affordable first focus. Long-term demand.
02:02
Future appreciation potential, payment structures, and the bigger financial picture behind this property. So if you're still wondering, is this actually affordable? Is this actually a smart buy?
02:14
what's a different strategy gonna change for my payment? And, if you're still wondering whether or not right now's the right time to buy for you or not, that's the million dollar question for everybody.
02:24
Click on the link below. When's the right time to buy? And more importantly, why?
02:28
To explore the facts, and what historical data actually shows us about today's housing market.
02:34
And make your decision, based on facts.
02:37
Not a bunch of social media hype, or someone else's opinion. So, scroll through this page, and explore the numbers about this house yourself, because…
02:46
What many buyers believe about affordability today?
02:49
does not tell the full story. Reach out to me with any questions. We'll talk to you soon.
Same Seller Contribution, Very Different Outcome — Presentation Overview
+ −What this presentation compares: This Total Cost Analysis uses the same purchase at 1908 Boxelder Aly to compare three 30-year FHA financing scenarios: no seller discount, a $9,750 price reduction, and seller funds applied to a permanent interest-rate buydown and closing costs. Each scenario shows an $11,375 down payment, making it easier to isolate how the negotiated seller strategy changes the loan, monthly payment, and cash needed at closing.
The baseline and price-cut scenarios: At the original $325,000 purchase price with a 5.990% interest rate, the presentation lists a $319,113 loan amount, 6.766% APR, an estimated $2,485.09 payment, and $19,359.59 cash to close. The $9,750 price reduction lowers the purchase price to $315,250 and the loan amount to $309,192 while keeping the displayed rate at 5.990%. That scenario shows a $2,413.52 estimated payment and $19,230.63 cash to close—$71.57 in monthly savings compared with the baseline.
The affordability-focused scenario: The third column keeps the $325,000 purchase price but applies the seller contribution toward a permanent rate buydown and closing costs. The displayed rate falls to 5.490%, the APR to 6.434%, the estimated payment to $2,383.71, and cash to close to $15,206.31. Against the baseline, the table shows $101.38 in monthly savings and $4,153.28 less cash required at closing. It also produces a lower displayed payment and substantially lower cash to close than the price-reduction scenario.
How to interpret the example: The comparison illustrates why buyers should evaluate how a seller concession is allocated instead of judging the negotiation only by the purchase price. It does not mean a permanent buydown is always the best choice. Actual results depend on current mortgage pricing, discount-point cost, FHA eligibility, seller-concession limits, credit profile, property details, taxes, insurance, and how long the buyer expects to keep the loan. The quote is dated May 10, 2026, and the figures are educational estimates rather than a loan approval or commitment.
The Difference Is Often Bigger Than Buyers Expect Image Overview
+ −What this image communicates
On “What If Asking For A Price Cut Was The Wrong Strategy,” the “The Difference Is Often Bigger Than Buyers Expect” visual isolates one decision from a larger housing conversation. As a primary visual message, it is meant to make one topic recognizable at a glance and give the reader a clear entry point into the deeper explanation on the page. The subject belongs to listing-positioning and buyer-perception strategy, where the useful question is whether presentation, price, payment framing, exposure, property condition, and buyer feedback are producing the right market response. The visual centers “The Difference Is Often Bigger Than Buyers Expect” on a specific housing or listing decision. It connects the visible promise to the property, the people involved, and the transaction sequence instead of leaving the message as abstract marketing. A useful reading separates what can be illustrated now from what still depends on the home's condition, the negotiated terms, verified financing, and current market response.
Why it belongs on this page
This price-cut strategy page uses one image to show that a seller concession or financing structure can create a larger payment effect than buyers expect from the same dollars applied only to price. The graphic should prompt an apples-to-apples calculation of seller cost, buyer payment, cash-to-close, loan balance, temporary or permanent benefit, appraisal, and program limits before anyone claims one option is better. The primary visual message role of “The Difference Is Often Bigger Than Buyers Expect” is the reason this image belongs at this point in “What If Asking For A Price Cut Was The Wrong Strategy?.”
How a reader can use it
Use “The Difference Is Often Bigger Than Buyers Expect” for its stated primary visual message job on “What If Asking For A Price Cut Was The Wrong Strategy.” Identify the claim, chart, comparison, process, property feature, or strategy shown and connect it to the exact decision the page addresses. The working notes for this panel should record the literal claim or comparison shown, the page fact it supports, the source behind that fact, and the decision the reader should make next. That record lets the reader distinguish a visibility problem, value objection, payment objection, property concern, or process obstacle before defaulting to another price cut without asking this image to answer a different stage of the decision.
What still must be verified
A marketing graphic cannot guarantee traffic, offers, sale price, appraisal, buyer qualification, property condition, or a particular time on market. “The Difference Is Often Bigger Than Buyers Expect” should therefore be treated as a primary visual message, not as transaction evidence by itself. Current documents, responsible sources, and the professionals accountable for the relevant decision must control when they differ from the illustration. On “What If Asking For A Price Cut Was The Wrong Strategy?,” that safeguard applies specifically to the primary visual message role assigned to “The Difference Is Often Bigger Than Buyers Expect.”