Before You Recommend a Price Cut, Answer One Question…
If the Buyer's Problem Is the Payment, Why Lead With a Price Cut?
Use the calculator below to compare a proposed price cut with a seller-paid permanent rate buydown using the same seller dollars.
Educational example. Actual rates, payments, costs, eligibility, and seller-contribution limits vary.
Price Cut vs. Permanent Rate Buydown Calculator
The price and a buyer's payment at today's rate.
Loan details
Cut the price, or buy down the buyer's rate.
Put toward a buydown, it lowers the buyer's rate and monthly payment.
Savings details
A price cut lowers the payment a little. A buydown can lower it even more.
Savings details
A buyer approved for at today's rate can afford the same monthly payment as your home with the buydown.
Affordability details
Summary details
| Today | Price Cut | Buydown | |
|---|---|---|---|
| Price | |||
| Interest rate | |||
| Monthly payment | |||
| Buyer saves |
This walkthrough is for example purposes only and is not an offer to lend. Example payments shown here include principal, interest, property taxes at of the price a year, homeowners insurance at a month, and mortgage insurance under 20% down. The approval comparison is based on the same full monthly payment. Actual rates, payments, and costs vary by lender and buyer.
Show Buyers What Matters To Them: The Payment & The Rate

Show Buyers What Matters To Them: The Payment & The Rate
The MLS Shows the House. We Help You Show the Opportunity.
We increase your listing's visibility with a custom property page that helps potential buyers understand the affordability strategies available to them and why the home may be a good investment.
The marketing analytics give you clear, shareable evidence of the campaign's reach and buyer engagement. This gives your seller proof that the listing is being seen, even before that attention becomes the right showing or offer.
What If the Seller Could Move Before the Listing Sells?

What If the Seller Could Move Before the Listing Sells?
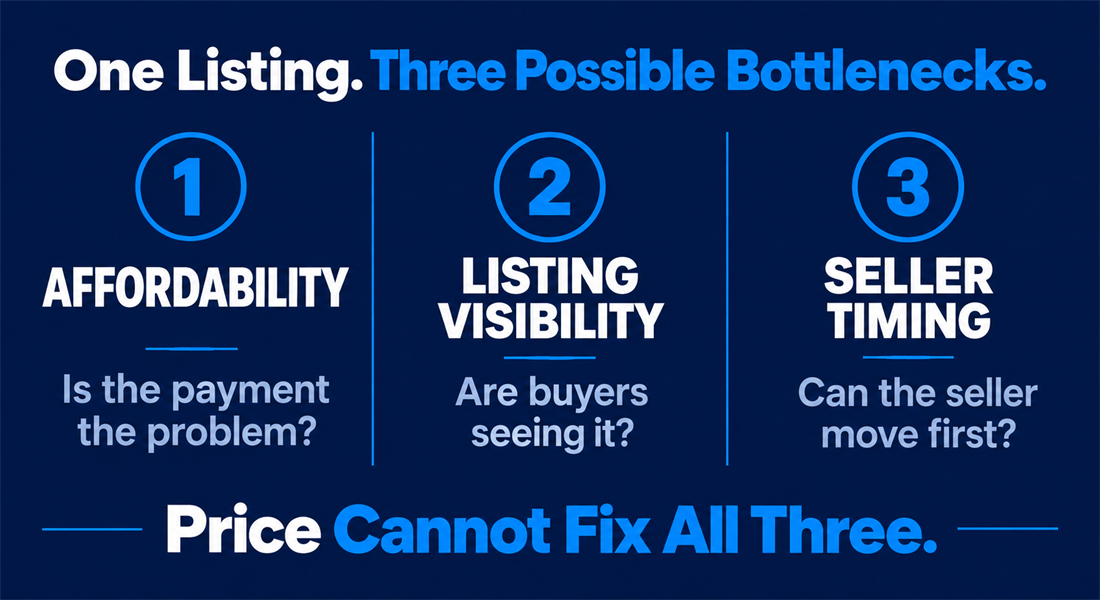
One Listing. Three Possible Problems. One Clearer Next Move.
Send me the property address, current list price, and what you are seeing. I will help you determine whether the next move is buyer affordability, listing visibility, seller timing, or a combination of the three. You stay fully in control of the listing and client relationship.
Call or text Michael at 615-585-5900, or schedule a 10-minute listing strategy review.
No pressure. No obligation. Just a clearer strategy you can take back to your seller.
Additional Information & Reference Guides
+ −One Listing. Three Possible Bottlenecks. Image Overview
+ −One Listing. Three Possible Bottlenecks shows why a stale real estate listing may not have a simple price problem. The image identifies three possible listing bottlenecks: buyer affordability, listing visibility, and seller timing. Buyer affordability asks whether the real obstacle is the list price or the buyer's monthly mortgage payment. Listing visibility asks whether buyers are seeing the property and understanding the opportunity. Seller timing asks whether the homeowner needs a way to buy and move before the current home sells. The image reinforces that price cannot solve all three problems and that the listing strategy should identify the real bottleneck before the seller gives up equity.
Price Cut vs. Permanent Rate Buydown Calculator Image Overview
+ −Price Cut vs. Permanent Rate Buydown Calculator compares how the same seller dollars may affect buyer affordability in two different ways. It begins with the listing price, down payment, current mortgage rate, proposed price reduction, seller-paid permanent rate buydown cost, and estimated property taxes and insurance. The calculator illustrates the buyer's estimated monthly payment at the current list price and rate. It then compares the payment impact of reducing the sales price with the payment impact of using seller funds toward a permanent mortgage rate buydown. This educational comparison helps listing agents and sellers see whether the buyer's obstacle may be the purchase price or the monthly payment. It also helps frame a more informed listing-strategy conversation before the seller automatically gives up equity through a price cut. Actual rates, payments, costs, eligibility, seller-contribution limits, and loan-program requirements vary by buyer and transaction.
Move the Seller First. Then Help Get the Listing Sold. Image Overview
+ −Move the Seller First. Then Help Get the Listing Sold explains a seller-transition strategy for qualified homeowners who want to purchase their next home before selling the current one. The image presents a five-step path: access available equity, buy the next home, move first, prepare the listing, and market the home. Moving first may give the seller more flexibility and may allow the agent to show a cleaner, less disrupted property. A moved-out home may also be easier to prepare, photograph, stage, and make available for showings. The strategy is designed to support the listing agent, not replace the agent or take control of the client relationship. The agent continues to handle the listing and real estate transaction while the financing team helps evaluate possible mortgage and equity options. Eligibility, financing availability, costs, timing, and program requirements depend on the seller, property, loan program, and transaction.
What Could 20,000, 30,000, or 40,000+ Listing Views Change? Image Overview
+ −What Could 20,000, 30,000, or 40,000+ Listing Views Change? shows how a custom property presentation, paid social promotion, and measurable campaign analytics can work together to create more visibility for a real estate listing. The image uses an authentic sample campaign to show a property advertisement, 33,182 listing views, an audience of 21,523 people, and 1,691 clicks. These figures are examples from the displayed campaign and are not a guarantee of future results. The visual also emphasizes that the property page can advertise the buyer's potential payment and affordability strategy, not merely repeat the list price and property details already available in the MLS. Clicking the image opens a verified sample listing presentation so agents can see how the calculator, financing explanation, property photos, listing details, and agent information work together. The sample helps a listing agent evaluate whether a similar property-specific marketing approach could support seller communication and buyer engagement. Actual reach, views, clicks, showings, offers, and results vary by property, market, audience, campaign, and budget.