Weekly Mortgage Market and Rate Update – August 24, 2026
Mortgage Rates Fell Slightly. Why Bond Pressure Stayed High.
Updated August 24, 2026
What Is the Market Doing?
Mortgage rates moved slightly lower in Freddie Mac’s latest national weekly survey, but the improvement was small.
Mortgage bonds improved briefly on Wednesday after the Treasury announced larger buyback operations for longer-term Treasury securities. More buying can support bond prices and help bring yields lower.
That improvement did not last. Higher oil prices and renewed tension involving Iran brought inflation concerns back into focus. Mortgage bonds moved lower again and finished near the bottom of their recent range.
Why did some of that improvement fade?
Higher oil prices can raise the cost of fuel, shipping, and everyday goods. That can quickly bring inflation concerns back.
Inflation matters because it reduces the value of the fixed payments that bonds provide. When inflation concerns rise, mortgage bonds may weaken, and mortgage rates may come under pressure.
Mortgage bonds and mortgage rates usually move in opposite directions. When bonds improve, rates may move lower. When bonds fall, rates may come under pressure.
What does the bond chart tell us?
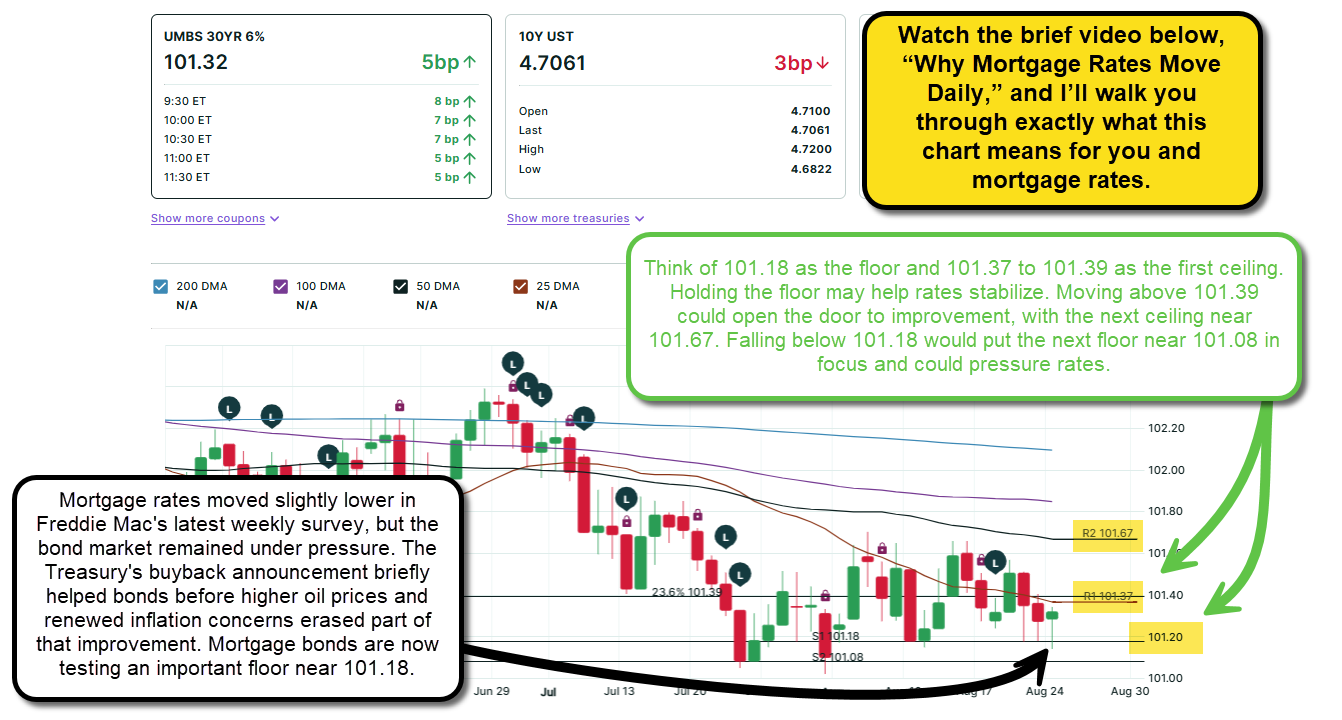
Mortgage bonds are trading near 101.32 and testing an important floor near 101.18.
Think of 101.18 as the floor under the market. Holding that floor may help stabilize rate conditions. If bonds fall below it, the next floor is near 101.08.
The first small hurdle is near 101.37. The more important ceiling is near 101.67. Moving above that ceiling would give bonds more room to improve.
- Holding above 101.18 may help rates stabilize.
- Moving above 101.37, then 101.67, could open the door to improvement.
- Falling below 101.18 would put the next floor near 101.08 in focus and could put rates under pressure again.
These are levels to watch, not promises about where rates will go.
What are we watching this week?
Tuesday brings new home sales and consumer confidence. These reports will show us whether buyers are purchasing newly built homes and how consumers feel about the economy.
Wednesday brings Personal Consumption Expenditures inflation, second-quarter economic growth, personal income, personal spending, and durable goods orders. Personal Consumption Expenditures, often called PCE, is the Federal Reserve’s preferred inflation measure.
Thursday brings jobless claims. Friday brings Federal Reserve Chair Kevin Warsh’s speech at the Jackson Hole Economic Policy Symposium. We are also watching oil prices and events involving Iran.
Bottom line
Mortgage rates moved slightly lower in the latest weekly survey, but the improvement was small. The Treasury’s buyback announcement briefly helped bonds before oil and inflation concerns pushed them lower again.
Mortgage bonds are now testing 101.18. Holding that floor could help rates settle down. A break below it would put the next floor near 101.08 in focus. Moving above 101.37 would be the first sign of improvement.
If you are wondering what these market changes mean for your plans, call or message me. I will explain what matters without all the confusing market talk.
This is a general market update, not a personal rate quote. Freddie Mac’s 6.65% figure is a national weekly survey average. Actual rates and costs depend on the borrower, property, loan program, market, and timing.
Mortgage Bond Market: Updated on 8-24-26
Mortgage Bond Market: Updated on 8-24-26
Watch the Trend, Not the Headline Rate
Below you’ll find the National Average Mortgage Rates as published for industry reference. These rates are for illustration only and reflect recently closed loans, not current market rates. Use this only for a general trend indicator. Your actual rate will depend on your financial profile and local market conditions, which is why getting pre-approved before you start shopping is key.
National Rate Averages
Historical Trend
Source: Optimal Blue Mortgage Market Indices (OBMMI). Indices reflect aggregate rate lock data. Learn more.
See What’s Happening: Locally & Nationally
The market moves fast. These two updates give you the clarity to stay ahead, so you can make confident, well-timed decisions, whether you’re buying, selling, or waiting.
MISSED A PREVIOUS WEEK'S UPDATE? CATCH UP HERE:
+ −Weekly Mortgage Market and Rate Update on 8-17-26
Weekly Mortgage Market and Rate Update on 8-10-26
Weekly Mortgage Market and Rate Update on 8-3-26
Weekly Mortgage Market and Rate Update on 7-28-26
Weekly Mortgage Market and Rate Update on 7-22-26
Weekly Mortgage Market and Rate Update on 7-15-26
Weekly Mortgage Market and Rate Update on 7-7-26
Weekly Mortgage Market and Rate Update on 6-30-26
Weekly Mortgage Market and Rate Update on 6-23-26
Weekly Mortgage Market and Rate Update on 6-16-26
Weekly Mortgage Market and Rate Update on 6-9-26
Weekly Mortgage Market and Rate Update on 6-2-26
Weekly Mortgage Market and Rate Update on 5-26-26
Weekly Mortgage Market and Rate Update on 5-19-26
Weekly Mortgage Market and Rate Update on 5-12-26
Weekly Mortgage Market and Rate Update on 5-6-26
Weekly Mortgage Market and Rate Update on 4-27-26
Weekly Mortgage Market and Rate Update on 4-22-26
WE'RE HERE TO HELP
If you have any questions or need more information about our affordable home financing solutions, please don’t hesitate to CONTACT ME. My team and I are here to help you every step of the way!
Ready to start your home journey? Click here to submit your loan application today!
Best regards,
Michael Thayer, CMPS, CMA
NMLS #173264
Planet Home Lending, NMLS #17022
Explore Buyer & Seller Resources & Next Steps
+ −Market Timing vs. Market Strategy: When Is the Right Time to Buy... And More Importantly, Why?
Calculators & Loan Programs Questions Answered: Mortgage Programs & Financing Calculator
Smart Financing Strategies to Lower Your Monthly Mortgage Payment: Smart Mortgage Strategies & Financing Hacks
Homebuying Roadmap: Your Mortgage GPS
Moving To Middle Tennessee: Moving To Middle Tennessee Resource Center
Search Open Houses: View All Middle Tennessee Open Houses
Main Resource Hub: Buyers, Sellers, Realtors, and Builders Resources and Strategies
Video Transcripts
+ −Mortgage rates change every day, but most people don’t understand why… Or what it actually means for them. This page (updated weekly) is designed to simplify everything. In this video, you’ll learn:
- How to track mortgage rate trends
- What’s happening in the bond market
- The simple “teeter-totter” relationship between mortgage bonds and rates
- What’s driving rate movement (inflation, economic data, market reactions)
Whether you're:
- A homebuyer (first-time or moving up)
- A Realtor or builder advising clients
- A real estate investor
This resource helps you stay ahead of the market and make more confident decisions. You’ll also find:
- Local Nashville market data
- National housing trends
- Weekly outlooks on where rates may be heading next
Bookmark this page and check back weekly to stay informed.
- Go to: www.michaelthayer.com
- Scroll down to "Weekly Mortgage Market and Rate Update"
- Save the link to check back for the weekly updates.
Have questions or want a breakdown for your local market? Reach out; I am happy to help.
Why Rates Move Daily:
Alright, before we get into this, let me be very clear: if anyone is telling you mortgage rates move for some random reason or pointing to anything other than what I’m about to explain, they’re wrong; you’re talking to the wrong person. Mortgage rates are driven by two core factors: inflation and the economic data that impacts it, and more specifically, how those factors influence the way mortgage bonds trade on Wall Street. That’s what ultimately drives the rates you and I see every day, and it really is that simple. Some people point to the 10-year Treasury as an indicator, and while it can be helpful, it doesn’t always tell the full story and can be misleading at times. Most people can’t explain this clearly, and that’s why this exists: to break it down simply so you finally have clarity. It can feel confusing because it’s counterintuitive, but once you understand that it works in the opposite way you might expect, it becomes much easier. Think of it like a teeter-totter: when one side goes up, the other side comes down, and that’s exactly how mortgage bonds and mortgage rates behave. What you’re looking at in a bond chart is daily movements shown as candlesticks; each bar represents one full day of trading. Green is good, meaning bonds improved and rates typically move lower; red is bad, meaning bonds declined and rates move higher. Now tie that back to the teeter-totter. When bond yields improve, rates get better; when bond yields decline, rates get worse. The biggest factor influencing all of this is inflation, because inflation erodes the value of bonds over time. When inflation rises or is expected to rise, bonds struggle, and when bonds struggle, mortgage rates increase. When inflation cools, bonds improve, and rates can move lower. So if you’re watching one thing, watch inflation; it’s the key driver. If inflation comes in higher than expected, expect rates to rise; if it cools, rates can improve. The good news is you don’t have to figure this out on your own. I break this down and update it every week, so you can understand the trend, see what’s happening, and make better decisions. Most people fear what they don’t understand, and that costs them money, but when you have clarity, you make stronger, more confident decisions. Use this as your resource, come back to it, and if you have questions, reach out. I’m here to help make sense of it all.
Additional Information & Reference Guides
+ −Mortgage Bond Market: Updated on 8-17-26 Image Overview
+ −What this image communicates
A reader encountering “Mortgage Bond Market: Updated on 8-17-26” should immediately recognize the dated mortgage-market evidence question inside “Weekly Mortgage Market and Rate Update.” The visual's role is primary visual message, so it must make one topic recognizable at a glance and give the reader a clear entry point into the deeper explanation on the page rather than merely repeat the headline. The image makes “Mortgage Bond Market: Updated on 8-17-26” the dominant visual message and gives the reader a defined entry point into the page's argument. The wording identifies what deserves attention first; the surrounding design establishes whether the reader is looking at a claim, a choice, a sequence, or a practical resource. That distinction determines what evidence should be gathered before the message is applied.
Why it belongs on this page
The August 17 market update reports relief after cooler inflation and weaker retail sales, followed by renewed pressure as oil climbed near $83 amid conflict and shipping disruption. The bond chart highlights support near 101.39, a smaller hurdle near 101.43, and a more important ceiling near 101.72. Those levels describe the chart at that update; they are not borrower pricing or permanent floors and ceilings. The primary visual message role of “Mortgage Bond Market: Updated on 8-17-26” is the reason this image belongs at this point in “Weekly Mortgage Market and Rate Update.”
How a reader can use it
Use “Mortgage Bond Market: Updated on 8-17-26” for its stated primary visual message job on “Weekly Mortgage Market and Rate Update.” Identify the claim, chart, comparison, process, property feature, or strategy shown and connect it to the exact decision the page addresses. The working notes for this panel should record the literal claim or comparison shown, the page fact it supports, the source behind that fact, and the decision the reader should make next. That record lets the reader separate a market explanation from the rate and costs available to one borrower for one property without asking this image to answer a different stage of the decision.
What still must be verified
Keep the visual in its proper role. A dated market image cannot guarantee a future rate, reproduce a Loan Estimate, or show the pricing adjustments attached to a particular credit, occupancy, property, loan amount, or lock period. If a later disclosure, source update, appraisal, inspection, title item, program rule, or contract term conflicts with “Mortgage Bond Market: Updated on 8-17-26,” the current controlling evidence takes priority. On “Weekly Mortgage Market and Rate Update,” that safeguard applies specifically to the primary visual message role assigned to “Mortgage Bond Market: Updated on 8-17-26.”