The Supply Problem Most People Don’t Realize Exists
The Housing Market Didn’t Just “Recover”... It Fundamentally Changed
Before the 2008 housing collapse, the United States had too many homes.
Builders were constructing homes faster than long-term household demand could support, while risky lending practices and speculative buying artificially inflated the market.
When the crash happened, builders pulled back aggressively.
Construction slowed dramatically. And unlike prior housing cycles, homebuilding never fully recovered.
At the same time, the population continued growing, new households kept forming, and housing demand slowly began rebuilding while supply remained limited.
That shift created a very different housing market than the one many people still associate with 2008.
Understanding that shift is one of the keys to understanding why today’s housing market behaves very differently from the market leading into the housing collapse.
63% Fewer Homes On The Market Today — Core Strategy and Decision Context
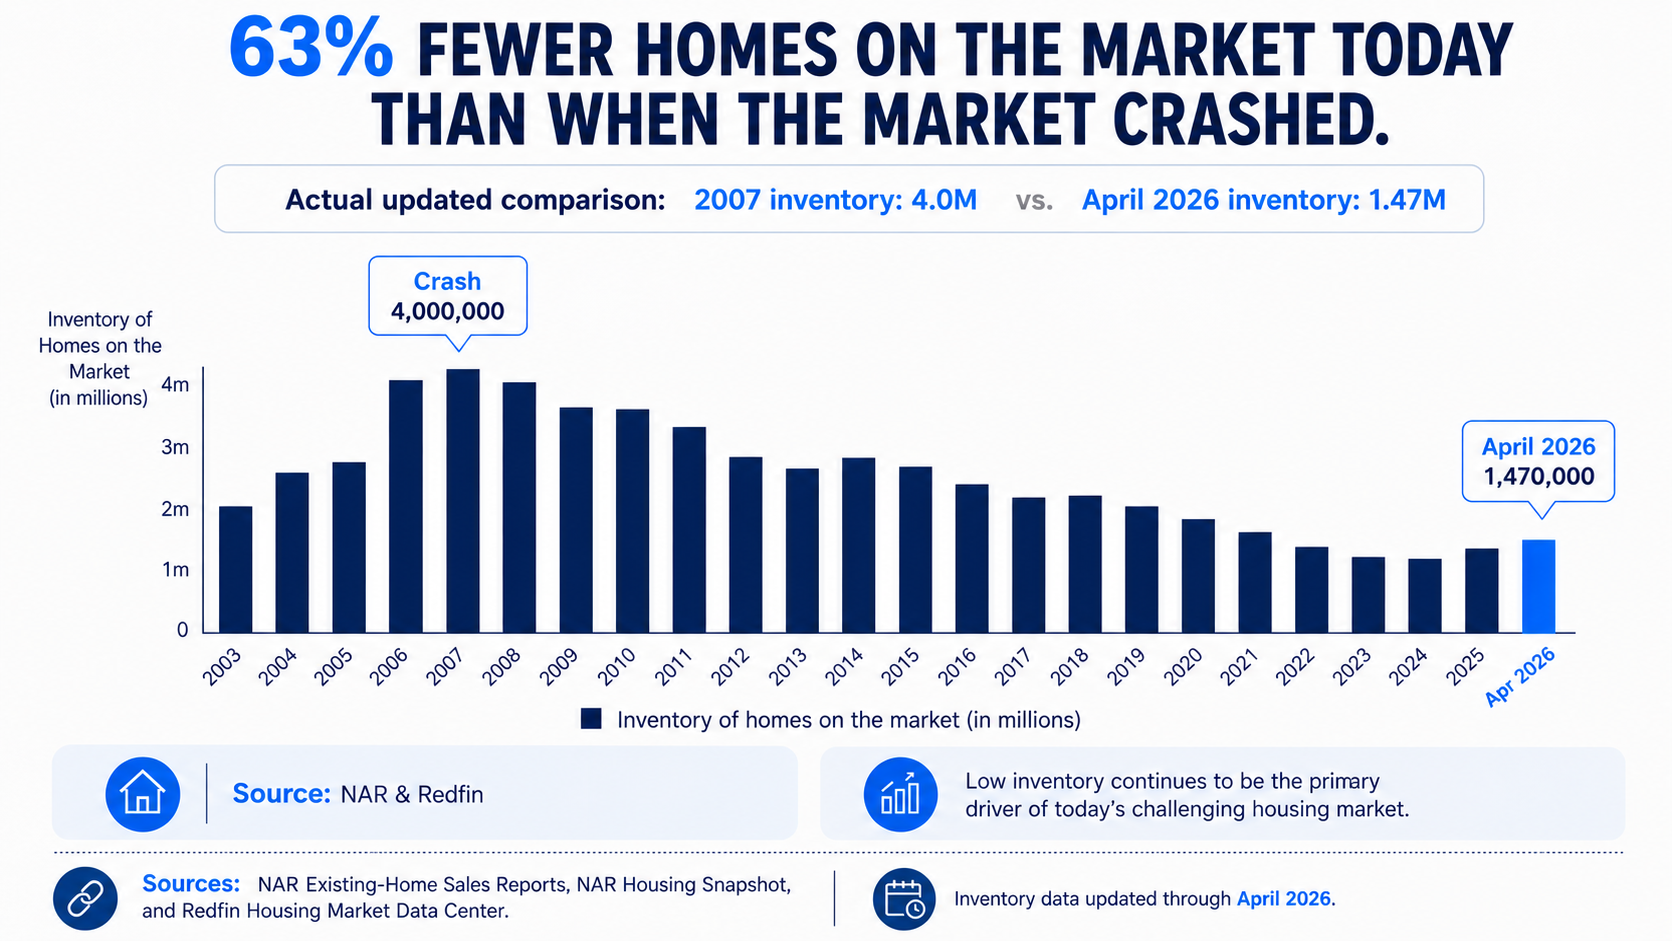
63% Fewer Homes On The Market Today — Core Strategy and Decision Context
This is one of the biggest differences between today’s market and the 2008 housing collapse.
Back then, inventory flooded the market.
Today, many parts of the country still face historically low housing supply levels, even after rates increased and affordability became more challenging.
That ongoing supply shortage is one of the major reasons home values have remained more resilient than many people expected.
The Supply Problem Didn’t Happen Overnight
The housing shortage most people experience today wasn’t created in a single year.
It developed slowly over time as household growth continued rising while builders struggled to keep pace with long-term demand.
And over time, that imbalance compounded.
Household Growth vs. Housing Completions — How the Process Works in Practice
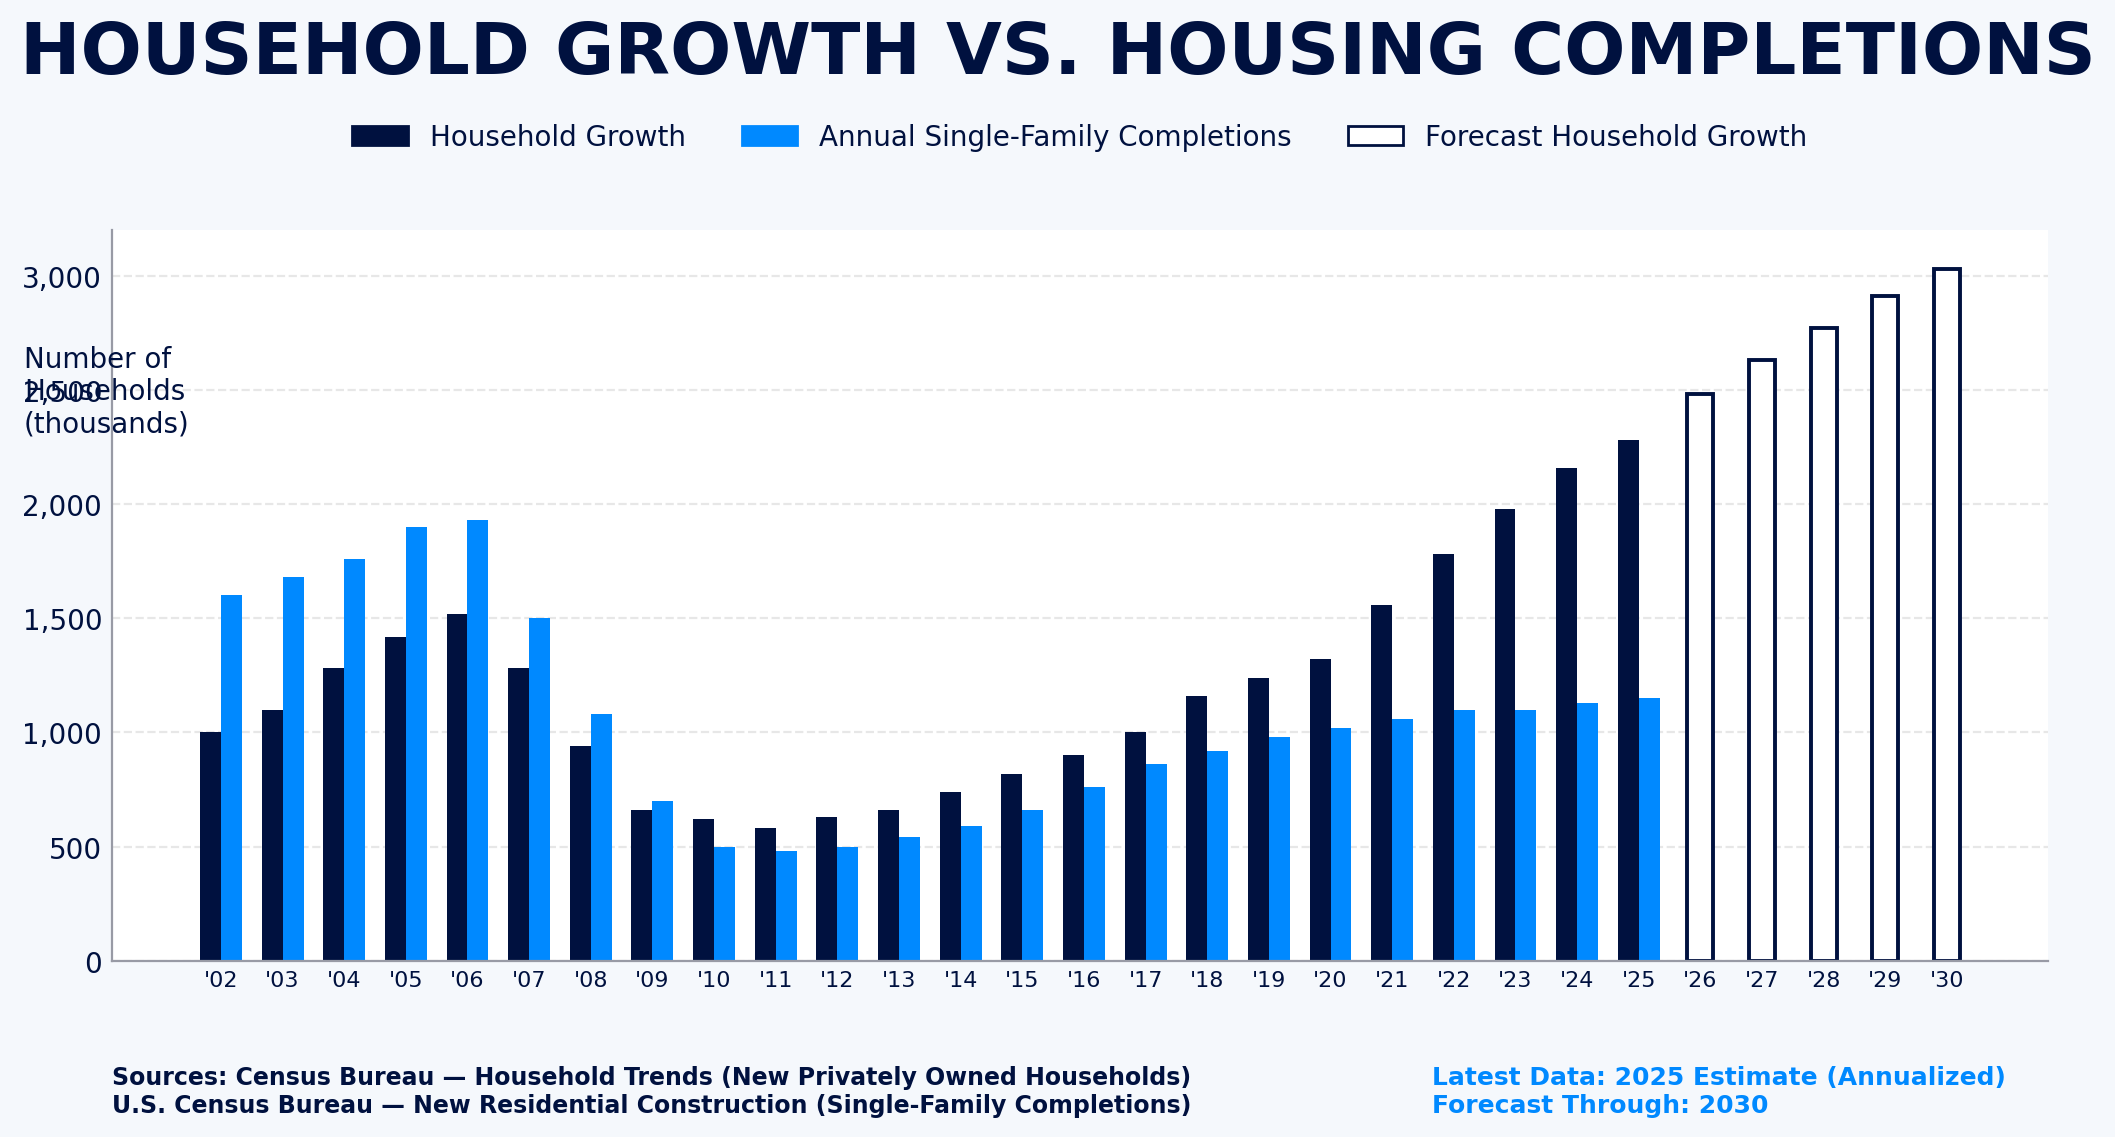
Household Growth vs. Housing Completions — How the Process Works in Practice
More Buyers.
Fewer Homes.
That’s The Core Of The Supply Problem.
When more households are competing for fewer available homes, prices naturally face upward pressure.
That does not mean prices rise forever.
And it does not mean markets cannot cool temporarily.
But it does help explain why today’s housing market behaves very differently from the oversupplied market that existed during the housing crash.
The U.S. Housing Supply Gap — Who This Resource Helps and Why
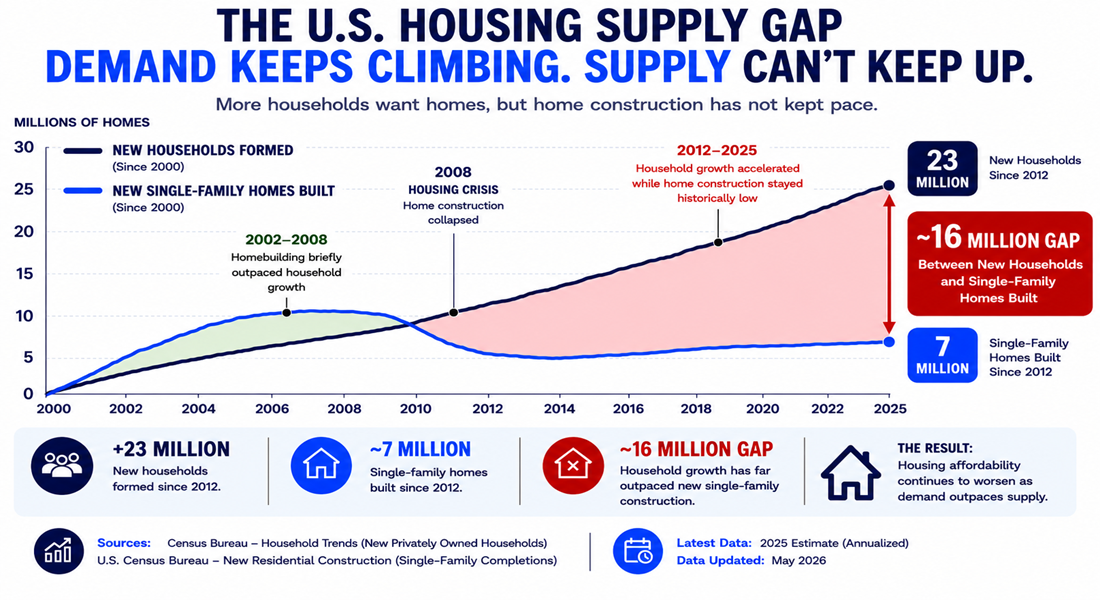
The U.S. Housing Supply Gap — Who This Resource Helps and Why
Understanding The Market Is Important. Building The Right Strategy Matters Even More.
Every housing market is local.
Every financial situation is different.
And every buyer’s timeline, goals, income structure, and comfort level are unique.
The purpose of understanding today’s supply-and-demand dynamics is not to pressure anyone into buying a home.
It’s to help people make more informed decisions based on market realities instead of headlines, fear, or outdated assumptions.
For some buyers, waiting may absolutely make sense.
For others, exploring financing strategies, payment options, affordability solutions, or alternative qualification approaches may reveal opportunities they didn’t realize existed.
The right strategy depends on the full financial picture.
Every Buyer’s Situation Is Different
The housing market is complex.
And unfortunately, many buyers today are hearing conflicting opinions, emotional headlines, social media hot takes, and one-size-fits-all advice without ever being shown the full picture.
That’s why this presentation series was created: to help buyers better understand the bigger picture of housing affordability, competition, leverage, market psychology, mortgage rates, and long-term financial strategy, and how these factors often work together rather than focusing on only one piece of the puzzle.
Click the links below to continue exploring the Housing Market Series:
➡️ Why Do Home Prices Keep Rising?
➡️ What History Shows Us About Home Values
➡️ What Happens When Rates Drop?
➡️ Why Waiting Could Create More Competition
➡️ Why Today’s Buyers Still Have Opportunity
➡️ Today’s Buyers Have More Leverage Than They Think
If you’d like help understanding how these market dynamics may impact your specific situation, we’re happy to walk through the numbers with you and help you evaluate your options clearly and strategically.
➡️ Schedule Your Strategy Call Here
Best regards,
Michael Thayer, CMPS, CMA
NMLS #173264
Planet Home Lending, NMLS #17022
Explore Buyer & Seller Resources & Next Steps
+ −Market Timing vs. Market Strategy: When Is the Right Time to Buy... And More Importantly, Why?
Calculators & Loan Programs Questions Answered: Mortgage Programs & Financing Calculator
Smart Financing Strategies to Lower Your Monthly Mortgage Payment: Smart Mortgage Strategies & Financing Hacks
Homebuying Roadmap: Your Mortgage GPS
Moving To Middle Tennessee: Moving To Middle Tennessee Resource Center
Search Open Houses: View All Middle Tennessee Open Houses
Main Resource Hub: Buyers, Sellers, Realtors, and Builders Resources and Strategies
Additional Information & Reference Guides
+ −Welcome Video Transcript
+ −Video Transcript
00:00
One of the biggest misconceptions in today's housing market is that home prices are higher simply because demand has exploded.
00:09
That's only part of the story.
00:11
The bigger problem?
00:13
We stopped building enough homes! For years!
00:17
And for most people, they didn't realize how large the gap is.
00:21
My name is Michael Thayer. I'm a mortgage advisor based in Nashville, Tennessee, serving clients nationwide. And since the housing crash.
00:28
Household formations has continued to climb.
00:32
But!
00:33
Home construction never fully recovered.
00:36
That means more buyers competing for fewer homes, tighter inventory, worsening affordability, and increasing pressure on housing prices over time.
00:47
And while the headlines often focus only on mortgage rates, the supply problem is one of the biggest forces shaping today's housing market.
00:57
Because when supply struggles to keep up with demand, Affordability becomes harder for everyone.
01:04
That's exactly what this page is designed to help you understand.
01:07
We'll walk you through what happened after the 2008 housing crash.
01:11
Why did construction slow so dramatically?
01:14
How today's housing shortage has developed, and why the market still feels so competitive in so many areas today.
01:22
Because understanding the housing market starts with understanding one simple reality.
01:28
We still do not have enough homes today, and we will not anytime soon.
01:33
So take a few minutes to explore the information on this page, and if you'd like to help us… help you understand how today's market conditions may impact your buying, selling, and financial strategy.
01:45
Call us. Set up a strategy call. Let's walk through your situation and figure out what may make sense for you and your goals. Talk to you soon.
63% Fewer Homes On The Market Today — Core Strategy and Decision Context Image Overview
+ −What this image communicates
On “The Supply Problem Most People Don’t Realize Exists,” the “63% Fewer Homes On The Market Today — Core Strategy and Decision Context” visual isolates one decision from a larger housing conversation. As a central strategy, it is meant to state the main tension clearly and show which decision should be made before secondary details distract from it. The subject belongs to housing-market evidence, where the useful question is what the chart or comparison says about supply, demand, prices, rates, equity, leverage, or competition at the geography and period actually measured. The graphic foregrounds the measured or numbered claim in “63% Fewer Homes On The Market Today” so the reader can see the scale, sequence, or direction being discussed. Numbers in this format are meaningful only with their date range, geography, unit, source, and comparison point. The visual's job is to make the pattern understandable while keeping the underlying measurement visible as a separate verification task.
Why it belongs on this page
The supply page explains why the number of available homes can remain constrained even when buyer demand changes. The central strategy role of “63% Fewer Homes On The Market Today” is the reason this image belongs at this point in “The Supply Problem Most People Don’t Realize Exists.”
How a reader can use it
Use “63% Fewer Homes On The Market Today” for its stated central strategy job on “The Supply Problem Most People Don’t Realize Exists.” Name the desired outcome, identify the constraint that could block it, and decide which evidence would change the answer. The working notes for this panel should record the desired result, the assumption carrying the most risk, the fact that would disprove it, and the decision that must be made first. That record lets the reader use market context to improve timing and negotiation questions without converting a broad statistic into a property-level prediction without asking this image to answer a different stage of the decision.
What still must be verified
The boundary is important. National or regional data cannot establish a specific home's value, condition, future appreciation, market time, offer activity, or the result of waiting. The “63% Fewer Homes On The Market Today — Core Strategy and Decision Context” image can improve preparation and questions, but it cannot replace the records, disclosures, findings, approvals, or agreements issued for the actual borrower, property, and transaction. On “The Supply Problem Most People Don’t Realize Exists,” that safeguard applies specifically to the central strategy role assigned to “63% Fewer Homes On The Market Today.”
Household Growth vs. Housing Completions — How the Process Works in Practice Image Overview
+ −What this image communicates
A reader encountering “Household Growth vs. Housing Completions — How the Process Works in Practice” should immediately recognize the housing-market evidence question inside “The Supply Problem Most People Don’t Realize Exists.” The visual's role is working sequence, so it must show the order of operations, the handoff between people, and the checkpoint that determines whether the next step is ready rather than merely repeat the headline. The visual uses a side-by-side comparison to separate “Household Growth vs. Housing Completions” into alternatives that should not be treated as interchangeable. Its layout asks the reader to compare structure, cost, timing, eligibility, and consequence—not select a winner from one headline number. The comparison is therefore a decision aid, with each column pointing to a different fact that must be confirmed.
Why it belongs on this page
Its three images move from a current inventory shortfall to the relationship between household formation and construction, then to the broader national housing gap. The working sequence role of “Household Growth vs. Housing Completions” is the reason this image belongs at this point in “The Supply Problem Most People Don’t Realize Exists.”
How a reader can use it
Use “Household Growth vs. Housing Completions” for its stated working sequence job on “The Supply Problem Most People Don’t Realize Exists.” Read the visual from the first confirmed fact through the next action, noting dependencies, deadlines, and the owner of each task. The working notes for this panel should record the starting condition, each dependent step, the responsible person, the handoff document, the deadline, and the condition required to advance. That record lets the reader use market context to improve timing and negotiation questions without converting a broad statistic into a property-level prediction without asking this image to answer a different stage of the decision.
What still must be verified
The explanation around “Household Growth vs. Housing Completions” must remain inside the evidence available for this page. National or regional data cannot establish a specific home's value, condition, future appreciation, market time, offer activity, or the result of waiting. The “Household Growth vs. Housing Completions — How the Process Works in Practice” visual supports a better-informed conversation, while the actual decision remains tied to current evidence and the people authorized to interpret it. On “The Supply Problem Most People Don’t Realize Exists,” that safeguard applies specifically to the working sequence role assigned to “Household Growth vs. Housing Completions.”
The U.S. Housing Supply Gap — Who This Resource Helps and Why Image Overview
+ −What this image communicates
The image titled “The U.S. Housing Supply Gap — Who This Resource Helps and Why” gives “The Supply Problem Most People Don’t Realize Exists” a focused reader and use-case map. Its communication job is to explain who benefits, what problem each person is trying to solve, and why the same information may lead to different questions. In this page context, the underlying subject is housing-market evidence: what the chart or comparison says about supply, demand, prices, rates, equity, leverage, or competition at the geography and period actually measured. The graphic foregrounds the measured or numbered claim in “The U.S. Housing Supply Gap” so the reader can see the scale, sequence, or direction being discussed. Numbers in this format are meaningful only with their date range, geography, unit, source, and comparison point. The visual's job is to make the pattern understandable while keeping the underlying measurement visible as a separate verification task.
Why it belongs on this page
The reader should distinguish listings currently for sale, annual completions, and cumulative shortage estimates because they measure different parts of the supply problem. The reader and use-case map role of “The U.S. Housing Supply Gap” is the reason this image belongs at this point in “The Supply Problem Most People Don’t Realize Exists.”
How a reader can use it
Use “The U.S. Housing Supply Gap” for its stated reader and use-case map job on “The Supply Problem Most People Don’t Realize Exists.” Match the graphic to the reader's role, current stage, pressure, and decision authority before applying its guidance. The working notes for this panel should record who the guidance is for, the reader's current stage, the decision they control, the problem they need solved, and when a specialist must take over. That record lets the reader use market context to improve timing and negotiation questions without converting a broad statistic into a property-level prediction without asking this image to answer a different stage of the decision.
What still must be verified
The final safeguard is verification. National or regional data cannot establish a specific home's value, condition, future appreciation, market time, offer activity, or the result of waiting. A reader should leave “The U.S. Housing Supply Gap — Who This Resource Helps and Why” knowing what to ask and what to gather—not believing that a graphic has already supplied an approval, valuation, legal conclusion, or guaranteed outcome. On “The Supply Problem Most People Don’t Realize Exists,” that safeguard applies specifically to the reader and use-case map role assigned to “The U.S. Housing Supply Gap.”