What Happens When Rates Drop?
Lower Rates Feel Like The Answer. But The Full Story Is More Complicated.
Lower mortgage rates can improve affordability and bring millions of buyers back into the market, but history shows there’s often more to the story than just a lower payment.
What Happens When Mortgage Rates Fall
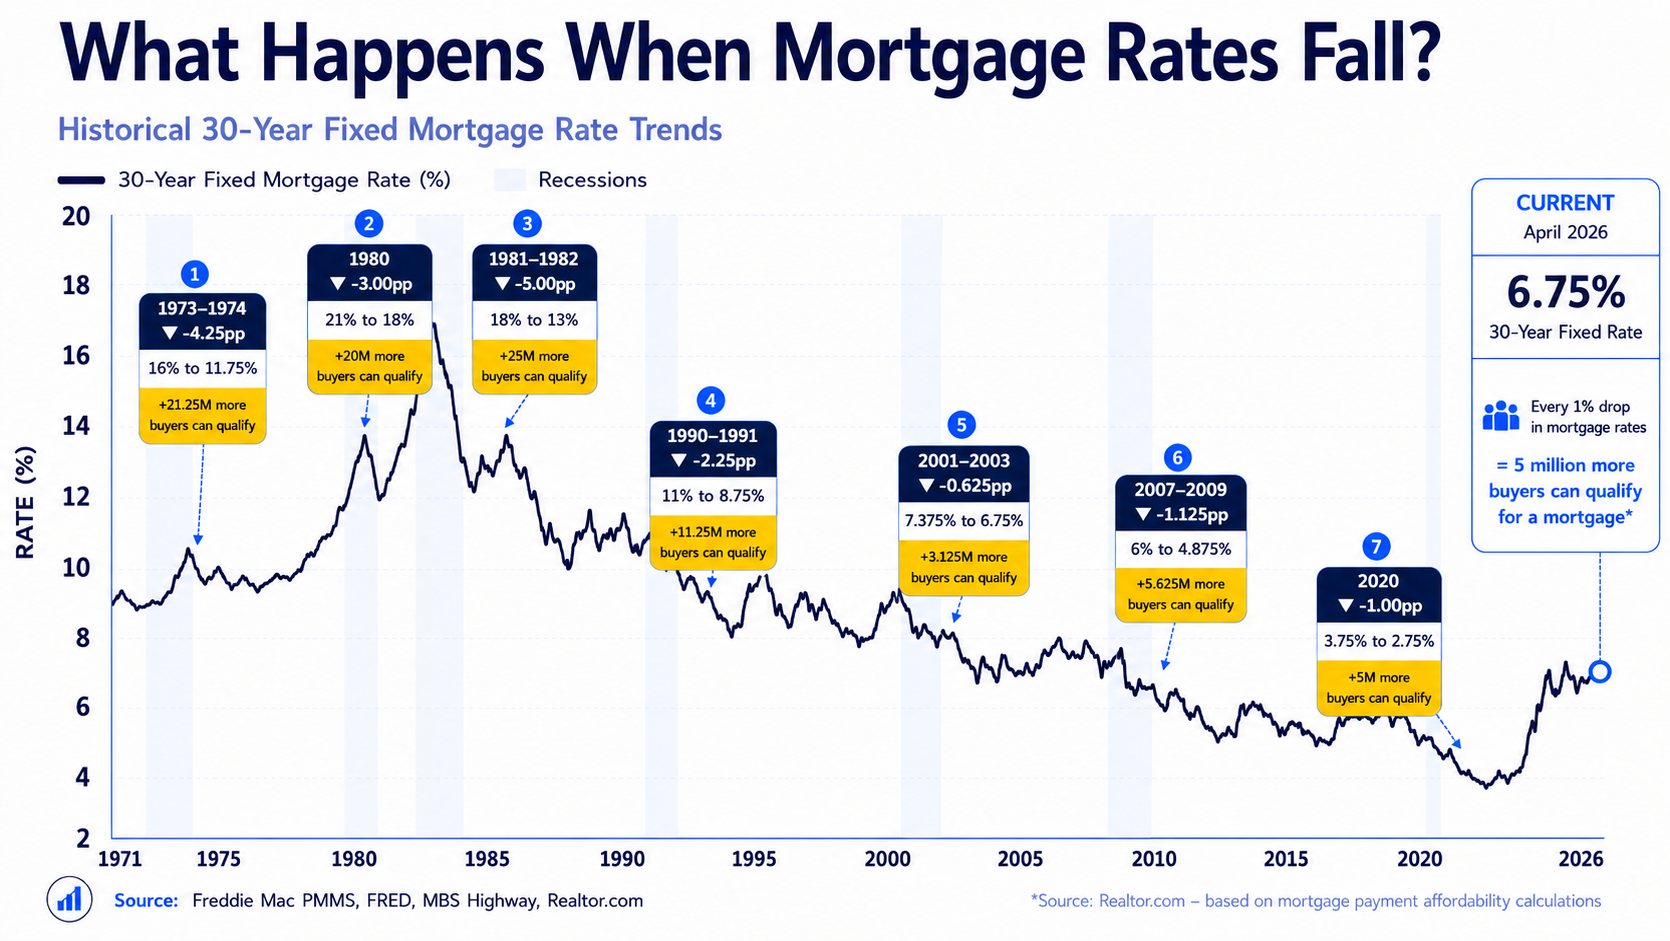
What Happens When Mortgage Rates Fall
Lower Rates Don't Always Create Easier Buying Conditions
For many buyers, waiting for mortgage rates to fall feels like the safest financial decision.
And on the surface, that makes sense.
A lower rate can:
➡️ Reduce your monthly payment
➡️ Improve affordability
➡️ Help more buyers qualify for financing
But what many people overlook is that mortgage rates don’t operate in isolation.
When rates fall:
➡️ More buyers re-enter the market
➡️ Competition often increases
➡️ Inventory can tighten quickly
➡️ And affordability pressure can return fast.
That’s why waiting for lower rates doesn’t always create the opportunity buyers expect.
Every 1% Drop In Rates Can Bring
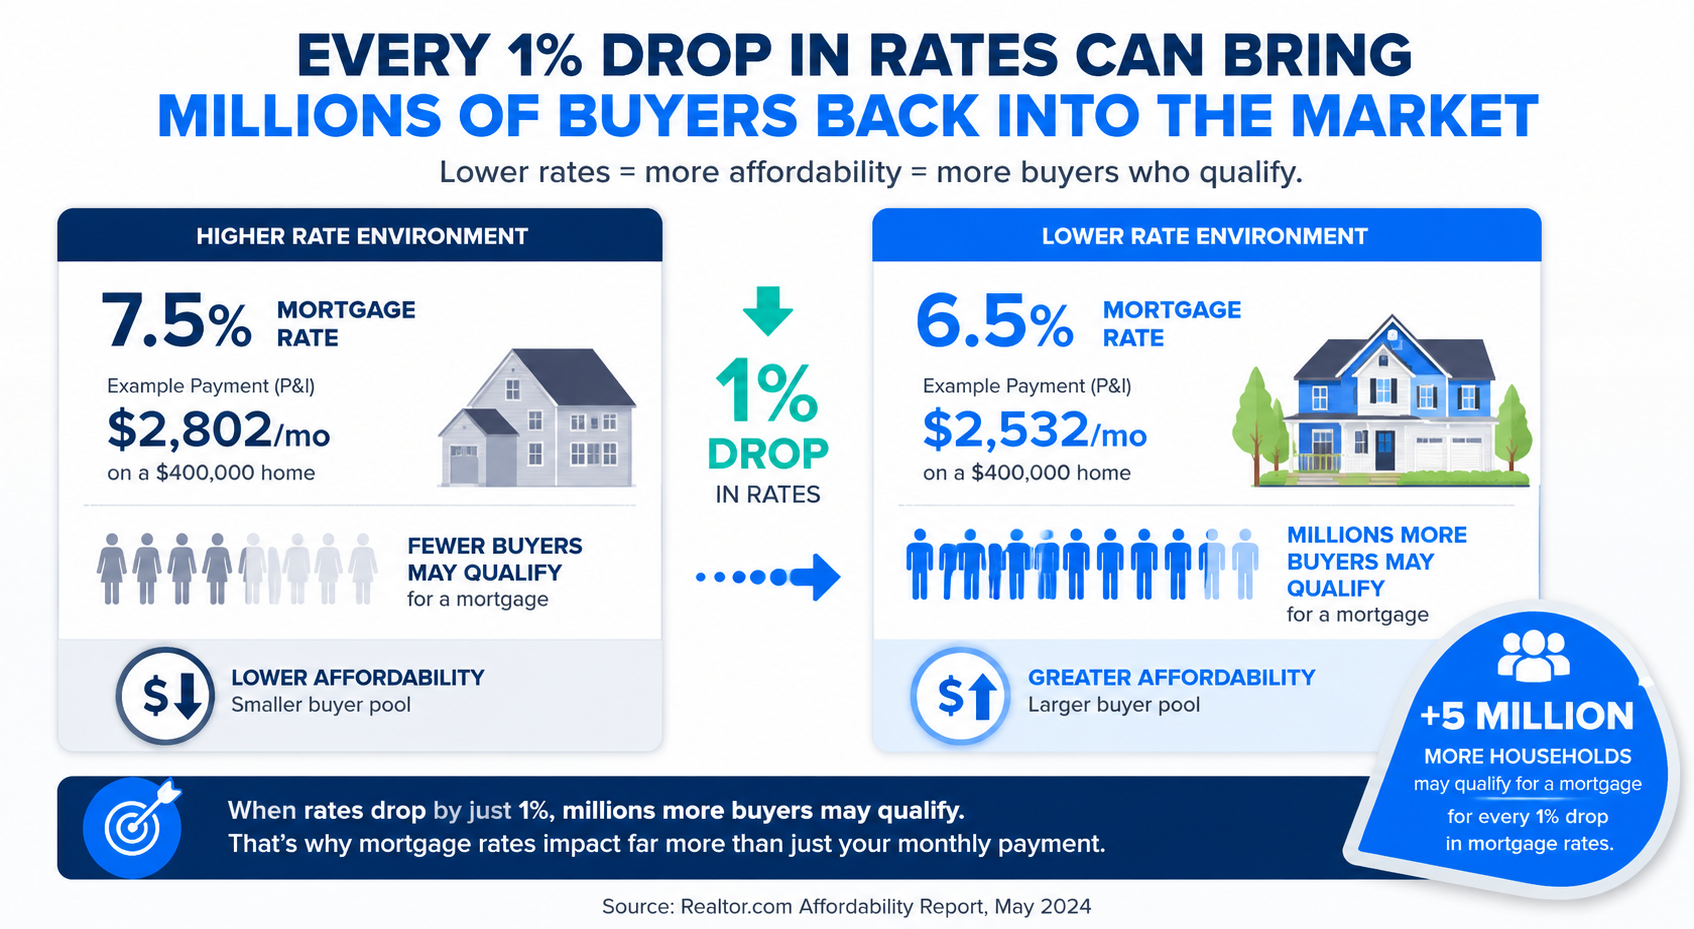
Every 1% Drop In Rates Can Bring
Why Lower Rates Can Change The Market Quickly
Lower rates can improve affordability, but they can also increase competition quickly.
According to housing affordability studies, millions of additional households may qualify for financing every time mortgage rates decline meaningfully.
As affordability improves, more buyers who were previously priced out of the market may begin shopping again.
That increase in buyer activity can:
➡️ Increase competition
➡️ Reduce negotiating leverage
➡️ Tighten inventory
➡️ And place renewed pressure on housing prices.
This is one of the biggest reasons mortgage rates matter for overall housing market dynamics.
The 2%-3% Mortgage Era — Who This Resource Helps and Why
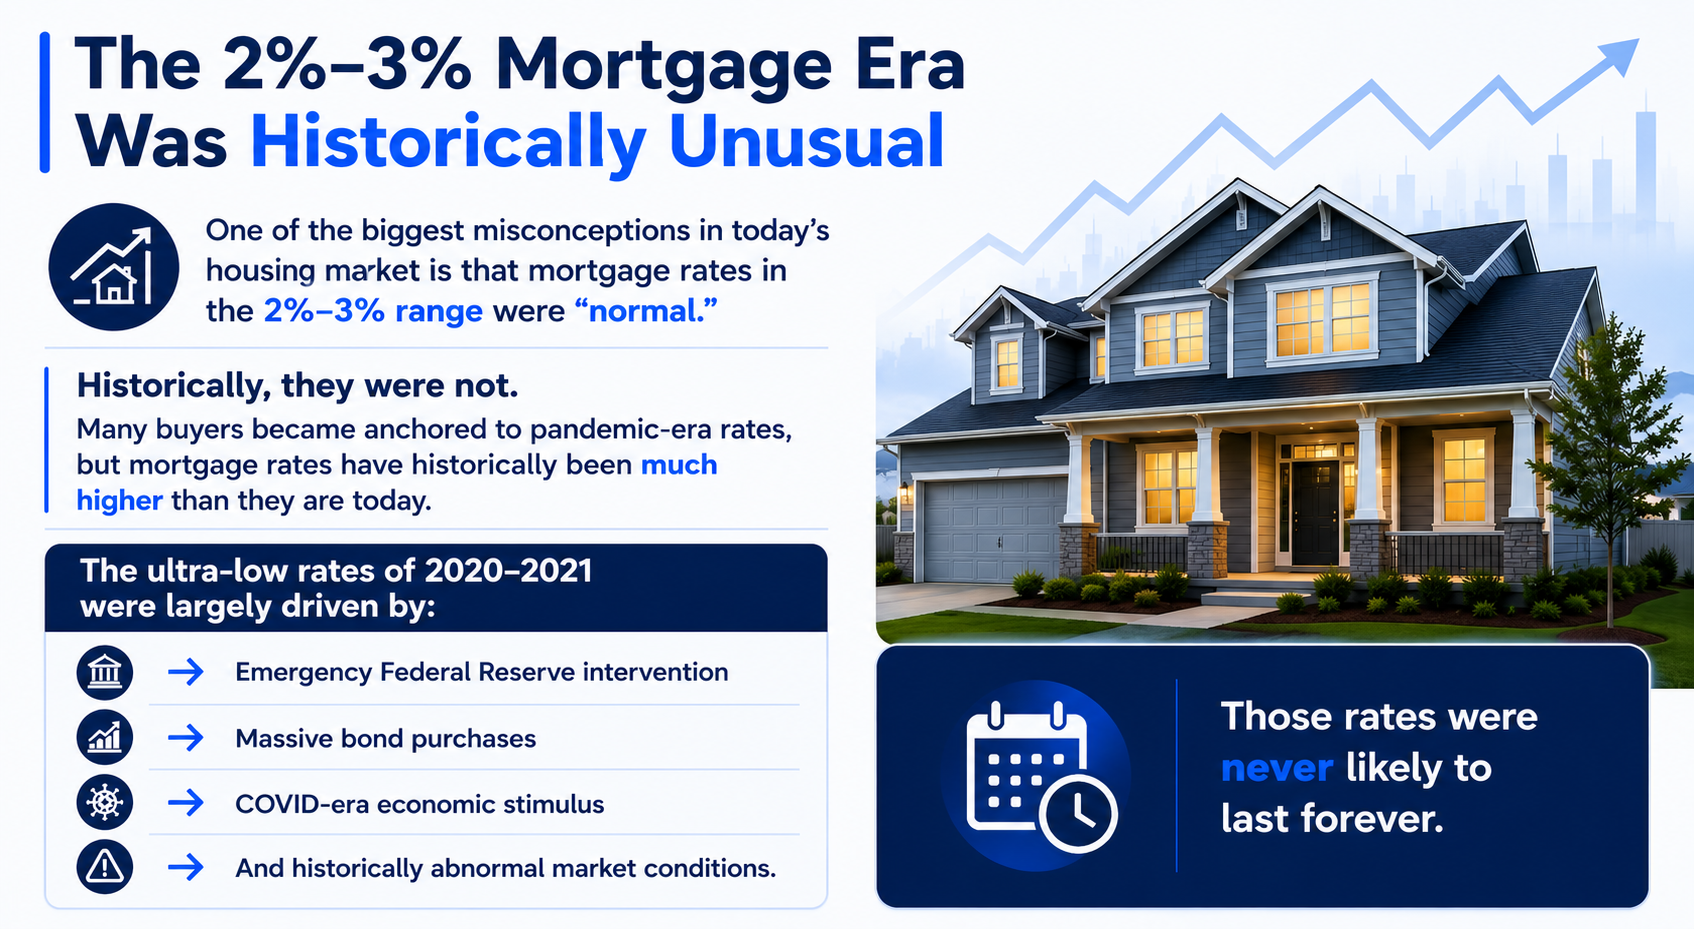
The 2%-3% Mortgage Era — Who This Resource Helps and Why
Mortgage Rates By Decade
Today’s rates may feel high compared to recent years…
But historically, they are not unprecedented.
Mortgage Rates By Decade — Documentation Calculations and Planning Details
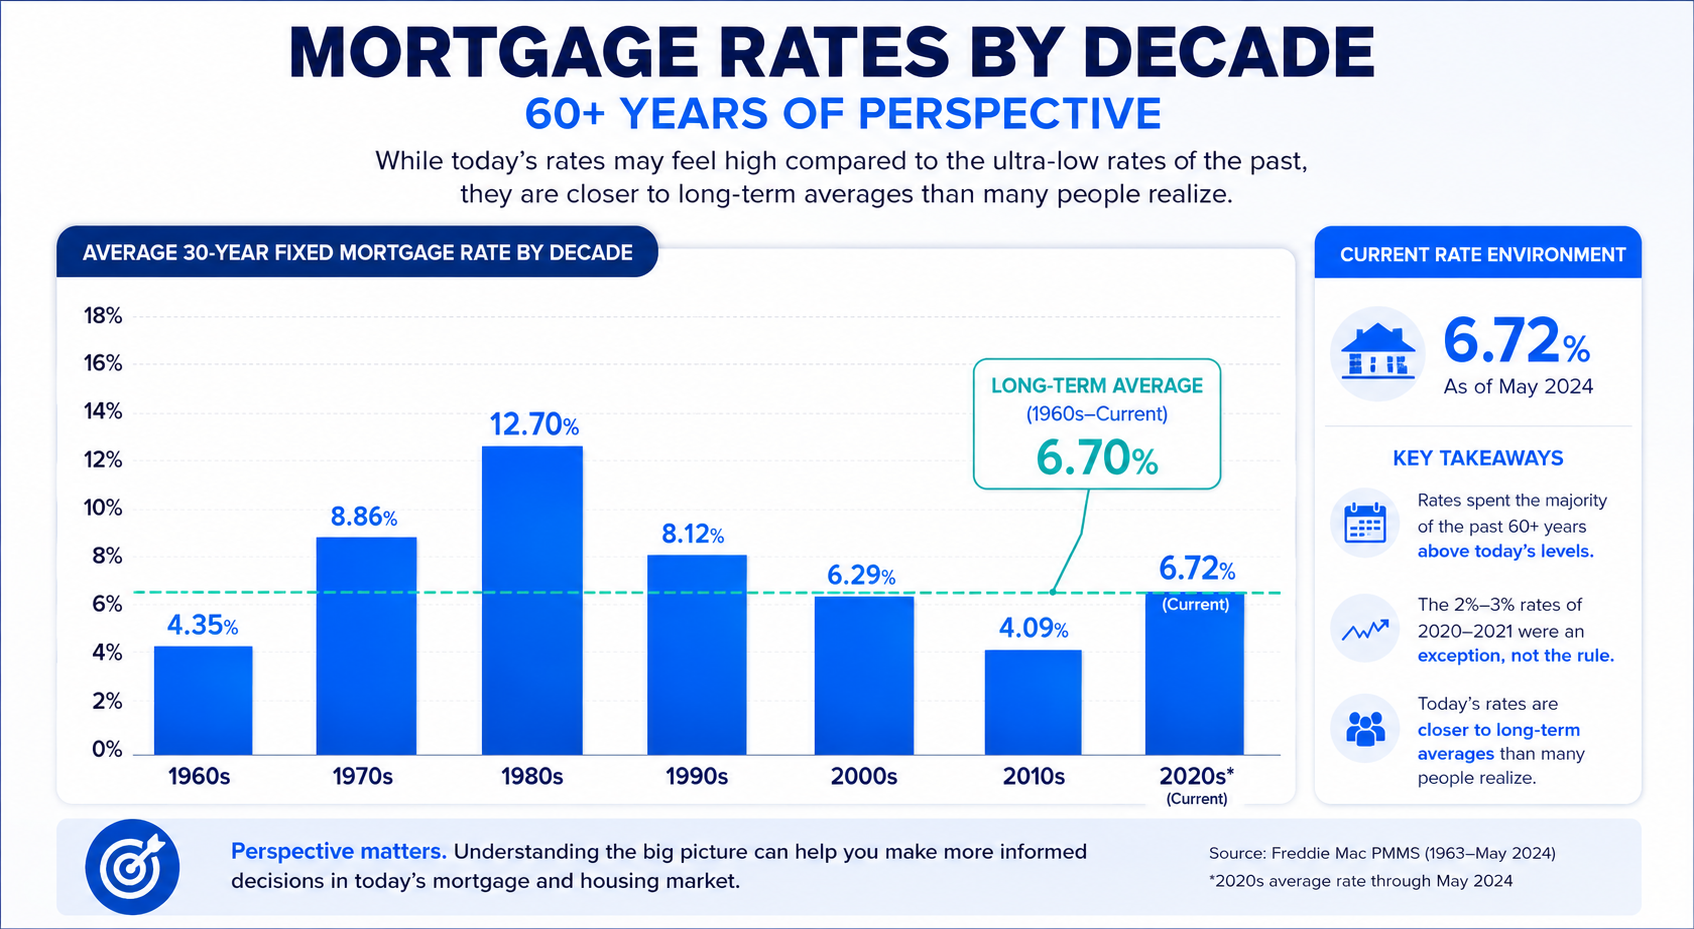
Mortgage Rates By Decade — Documentation Calculations and Planning Details
Historically, mortgage rates have moved through long-term cycles.
And while today’s mortgage rates may feel high compared to the ultra-low pandemic-era rates many buyers became accustomed to, history shows rates have often operated much higher than current levels.
In fact, mortgage rates spent large portions of the:
- 1960s
- 1970s
- 1980s
- 1990s
- and the early 2000s
Well above many of today’s levels. That doesn’t mean rates can’t move lower in the future.
They absolutely can.
But understanding historical context helps create more realistic expectations about how housing markets and affordability cycles evolve over time.
The 2% and 3% mortgage rate environment seen during COVID was historically unusual and largely driven by:
➡️ Severe economic disruption
➡️ Extraordinary Federal Reserve intervention
➡️ Massive bond-buying programs
➡️ And emergency stimulus policies.
While future mortgage rates are impossible to predict, those conditions were historically abnormal compared to long-term mortgage rate trends.
Mortgage Rates Impact — Tradeoffs Limitations and Next Steps
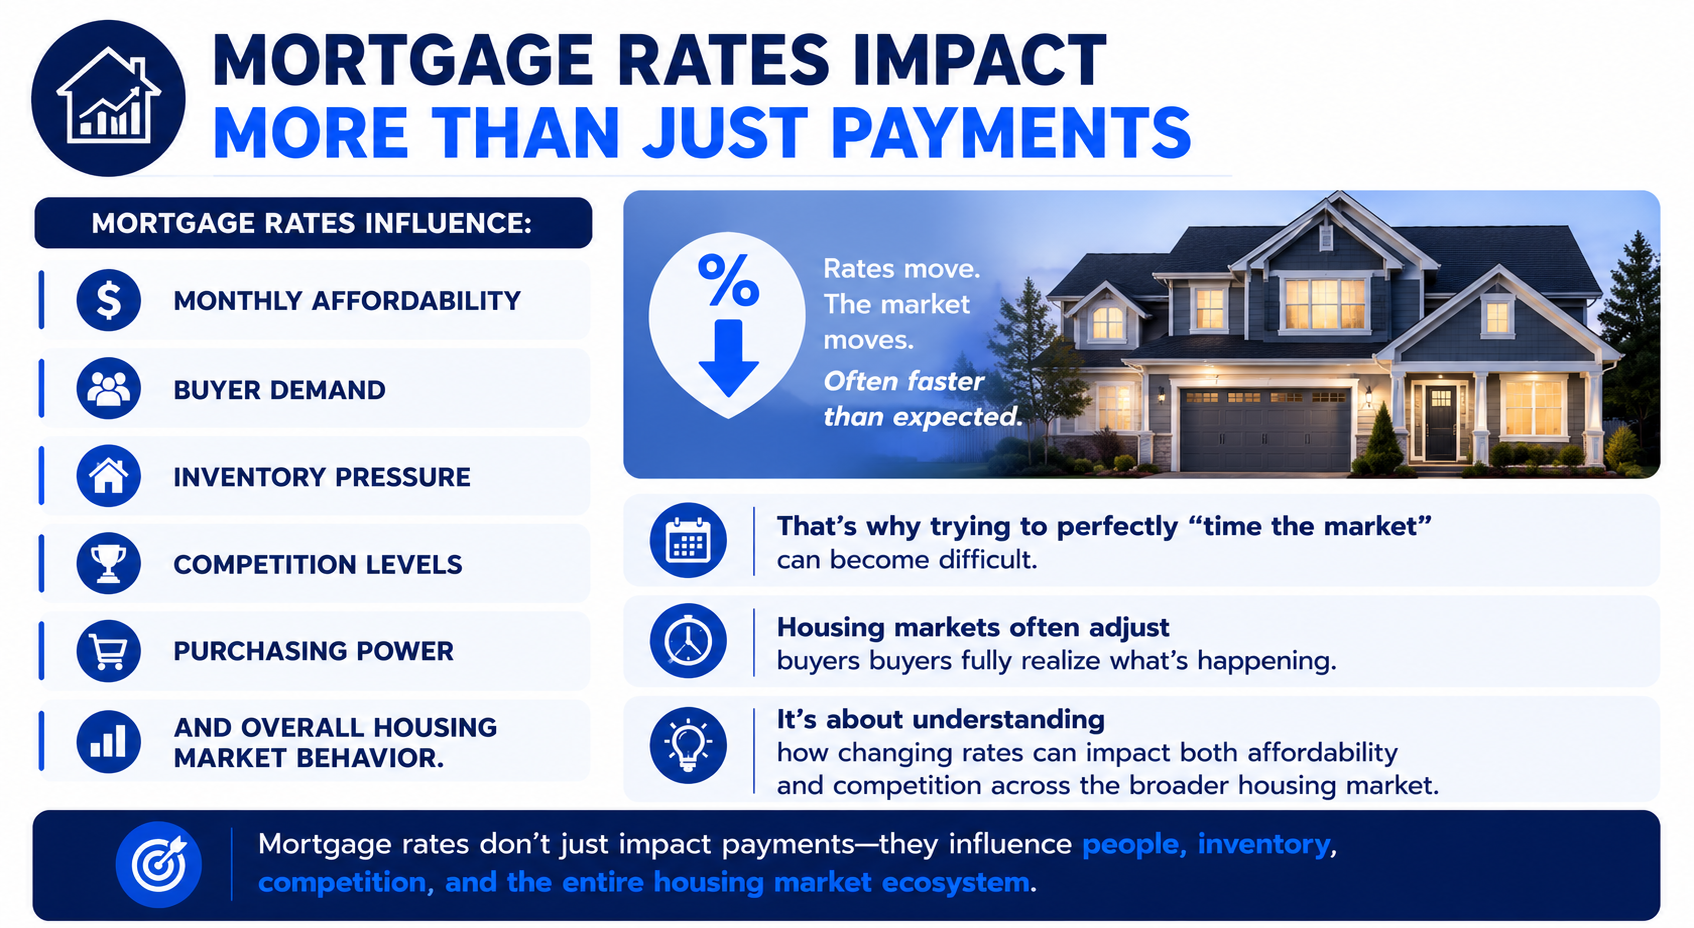
Mortgage Rates Impact — Tradeoffs Limitations and Next Steps
Lower Rates Can Change Buyer Competition Quickly
Lower rates don’t simply improve affordability.
They can rapidly increase:
➡️ Buyer traffic
➡️ Showing activity
➡️ Multiple-offer situations
➡️ Competition levels
➡️ And overall market momentum.
Understanding how rates influence buyer psychology is one of the most important parts of understanding today’s housing market.
The Right Strategy — Local Evidence and Practical Application

The Right Strategy — Local Evidence and Practical Application
Every Buyer’s Situation Is Different
The housing market is complex.
And unfortunately, many buyers today are hearing conflicting opinions, emotional headlines, social media hot takes, and one-size-fits-all advice without ever being shown the full picture.
That’s why this presentation series was created: to help buyers better understand the bigger picture of housing affordability, competition, leverage, market psychology, mortgage rates, and long-term financial strategy, and how these factors often work together rather than focusing on only one piece of the puzzle.
Click the links below to continue exploring the Housing Market Series:
➡️ The Supply Problem Most People Don’t Realize Exists
➡️ Why Do Home Prices Keep Rising?
➡️ What History Shows Us About Home Values
➡️ Why Waiting Could Create More Competition
➡️ Why Today’s Buyers Still Have Opportunity
➡️ Today’s Buyers Have More Leverage Than They Think
If you’d like help understanding how these market dynamics may impact your specific situation, we’re happy to walk through the numbers with you and help you evaluate your options clearly and strategically.
➡️ Schedule Your Strategy Call Here
Best regards,
Michael Thayer, CMPS, CMA
NMLS #173264
Planet Home Lending, NMLS #17022
Explore Buyer & Seller Resources & Next Steps
+ −Market Timing vs. Market Strategy: When Is the Right Time to Buy... And More Importantly, Why?
Calculators & Loan Programs Questions Answered: Mortgage Programs & Financing Calculator
Smart Financing Strategies to Lower Your Monthly Mortgage Payment: Smart Mortgage Strategies & Financing Hacks
Homebuying Roadmap: Your Mortgage GPS
Moving To Middle Tennessee: Moving To Middle Tennessee Resource Center
Search Open Houses: View All Middle Tennessee Open Houses
Main Resource Hub: Buyers, Sellers, Realtors, and Builders Resources and Strategies
Additional Information & Reference Guides
+ −Welcome Video Transcript
+ −Video Transcript
00:00
Here's another big misconception in today's housing market: if rates drop, buying automatically gets easier, right?
00:08
Not exactly. The reality is often much more complicated than that.
00:12
And if you're serious about understanding when the right time is to buy.
00:16
You're probably not gonna find the correct answer you need in a 30-second rule. Just saying.
00:21
Because it takes a few minutes to understand what's really happening underneath the headlines. My name is Michael Thayer. I'm a mortgage advisor based in Nashville, Tennessee, serving clients nationwide. And yes, a lower rate can improve affordability.
00:36
But, they also bring back
00:38
millions of buyers back in the market very quickly. And when buyers suddenly re-enter the market simultaneously.
00:46
Competition can increase. Inventory can tighten. Bidding wars will return.
00:51
And affordability pressures can rise again.
00:54
Because mortgage rates impact far more than just mortgage payments. They influence buyer demand, purchasing power, competition levels, inventory pressure, and overall housing market behavior. And one of the biggest things that many people don't realize is this. Those ultra-low 2-3% mortgage rates during COVID?
01:14
was historically low. That's why they call them historical rates.
01:18
Those rates were never going to last. Forever.
01:22
That's exactly what this page is designed to help you understand. We walk you through what historically happens when rates fall.
01:30
Why? Lower rates can increase competition.
01:33
Why mortgage rates impact the broader housing market, and why trying to time the market is often far more complicated than people think.
01:42
So take a few minutes to explore the information below. And if you'd like help reviewing your own situation and understanding which strategies may make sense for you and your goals, schedule a strategy call. We'll walk through it together. Talk to you soon.
What Happens When Mortgage Rates Fall Image Overview
+ −What this image communicates
The image titled “What Happens When Mortgage Rates Fall” gives “What Happens When Rates Drop” a focused primary visual message. Its communication job is to make one topic recognizable at a glance and give the reader a clear entry point into the deeper explanation on the page. In this page context, the underlying subject is homebuying decision framework: how goals, payment comfort, cash needs, property fit, timing, risk, and professional responsibilities come together. The graphic foregrounds the measured or numbered claim in “What Happens When Mortgage Rates Fall” so the reader can see the scale, sequence, or direction being discussed. Numbers in this format are meaningful only with their date range, geography, unit, source, and comparison point. The visual's job is to make the pattern understandable while keeping the underlying measurement visible as a separate verification task.
Why it belongs on this page
The falling-rate resource shows why lower mortgage rates can change buyer purchasing power and competition at the same time. The primary visual message role of “What Happens When Mortgage Rates Fall” is the reason this image belongs at this point in “What Happens When Rates Drop?.”
How a reader can use it
Use “What Happens When Mortgage Rates Fall” for its stated primary visual message job on “What Happens When Rates Drop.” Identify the claim, chart, comparison, process, property feature, or strategy shown and connect it to the exact decision the page addresses. The working notes for this panel should record the literal claim or comparison shown, the page fact it supports, the source behind that fact, and the decision the reader should make next. That record lets the reader turn a broad housing question into a smaller set of facts, tradeoffs, and next actions without asking this image to answer a different stage of the decision.
What still must be verified
The image is valuable because it frames the right issue, not because it proves the answer. The image provides education, not a loan decision, property valuation, legal conclusion, tax result, inspection finding, insurance commitment, or guarantee of future market performance. “What Happens When Mortgage Rates Fall” remains educational until the current borrower, property, market, and transaction evidence supports a specific conclusion. On “What Happens When Rates Drop?,” that safeguard applies specifically to the primary visual message role assigned to “What Happens When Mortgage Rates Fall.”
Every 1% Drop In Rates Can Bring Image Overview
+ −What this image communicates
“Every 1% Drop In Rates Can Bring” establishes the visual entry point for this part of “What Happens When Rates Drop.” Its primary visual message framing helps the reader understand how to make one topic recognizable at a glance and give the reader a clear entry point into the deeper explanation on the page. The decision underneath the graphic is how goals, payment comfort, cash needs, property fit, timing, risk, and professional responsibilities come together. The graphic foregrounds the measured or numbered claim in “Every 1% Drop In Rates Can Bring” so the reader can see the scale, sequence, or direction being discussed. Numbers in this format are meaningful only with their date range, geography, unit, source, and comparison point. The visual's job is to make the pattern understandable while keeping the underlying measurement visible as a separate verification task.
Why it belongs on this page
Its six images cover the immediate mechanism, a one-percentage-point illustration, the unusual 2–3% era, decade-level rate history, payment impact, and the need for an individual strategy. The primary visual message role of “Every 1% Drop In Rates Can Bring” is the reason this image belongs at this point in “What Happens When Rates Drop?.”
How a reader can use it
Use “Every 1% Drop In Rates Can Bring” for its stated primary visual message job on “What Happens When Rates Drop.” Identify the claim, chart, comparison, process, property feature, or strategy shown and connect it to the exact decision the page addresses. The working notes for this panel should record the literal claim or comparison shown, the page fact it supports, the source behind that fact, and the decision the reader should make next. That record lets the reader turn a broad housing question into a smaller set of facts, tradeoffs, and next actions without asking this image to answer a different stage of the decision.
What still must be verified
Keep the visual in its proper role. The image provides education, not a loan decision, property valuation, legal conclusion, tax result, inspection finding, insurance commitment, or guarantee of future market performance. If a later disclosure, source update, appraisal, inspection, title item, program rule, or contract term conflicts with “Every 1% Drop In Rates Can Bring,” the current controlling evidence takes priority. On “What Happens When Rates Drop?,” that safeguard applies specifically to the primary visual message role assigned to “Every 1% Drop In Rates Can Bring.”
The 2%-3% Mortgage Era — Who This Resource Helps and Why Image Overview
+ −What this image communicates
“The 2%-3% Mortgage Era — Who This Resource Helps and Why” is not a decorative break in “What Happens When Rates Drop.” It is the page's reader and use-case map, designed to explain who benefits, what problem each person is trying to solve, and why the same information may lead to different questions. That framing matters because the reader is evaluating how goals, payment comfort, cash needs, property fit, timing, risk, and professional responsibilities come together. The graphic foregrounds the measured or numbered claim in “The 2%-3% Mortgage Era” so the reader can see the scale, sequence, or direction being discussed. Numbers in this format are meaningful only with their date range, geography, unit, source, and comparison point. The visual's job is to make the pattern understandable while keeping the underlying measurement visible as a separate verification task.
Why it belongs on this page
The page is useful when readers compare total cost and market response rather than waiting for one headline rate. The reader and use-case map role of “The 2%-3% Mortgage Era” is the reason this image belongs at this point in “What Happens When Rates Drop?.”
How a reader can use it
Use “The 2%-3% Mortgage Era” for its stated reader and use-case map job on “What Happens When Rates Drop.” Match the graphic to the reader's role, current stage, pressure, and decision authority before applying its guidance. The working notes for this panel should record who the guidance is for, the reader's current stage, the decision they control, the problem they need solved, and when a specialist must take over. That record lets the reader turn a broad housing question into a smaller set of facts, tradeoffs, and next actions without asking this image to answer a different stage of the decision.
What still must be verified
“The 2%-3% Mortgage Era” organizes the reader and use-case map part of the decision; it does not settle the rest. The image provides education, not a loan decision, property valuation, legal conclusion, tax result, inspection finding, insurance commitment, or guarantee of future market performance. The responsible next step after “The 2%-3% Mortgage Era — Who This Resource Helps and Why” is to obtain the current document or finding that governs the issue and reconcile any difference before proceeding. On “What Happens When Rates Drop?,” that safeguard applies specifically to the reader and use-case map role assigned to “The 2%-3% Mortgage Era.”
Mortgage Rates By Decade — Documentation Calculations and Planning Details Image Overview
+ −What this image communicates
On “What Happens When Rates Drop,” the “Mortgage Rates By Decade — Documentation Calculations and Planning Details” visual isolates one decision from a larger housing conversation. As a evidence and calculation layer, it is meant to separate measurable inputs from assumptions and reveal which figures or documents control the comparison. The subject belongs to homebuying decision framework, where the useful question is how goals, payment comfort, cash needs, property fit, timing, risk, and professional responsibilities come together. The graphic foregrounds the measured or numbered claim in “Mortgage Rates By Decade” so the reader can see the scale, sequence, or direction being discussed. Numbers in this format are meaningful only with their date range, geography, unit, source, and comparison point. The visual's job is to make the pattern understandable while keeping the underlying measurement visible as a separate verification task.
Why it belongs on this page
The falling-rate resource shows why lower mortgage rates can change buyer purchasing power and competition at the same time. The evidence and calculation layer role of “Mortgage Rates By Decade” is the reason this image belongs at this point in “What Happens When Rates Drop?.”
How a reader can use it
Use “Mortgage Rates By Decade” for its stated evidence and calculation layer job on “What Happens When Rates Drop.” Write down every input, source, date, unit, estimate, and unresolved condition before relying on a calculation or side-by-side result. The working notes for this panel should record each number, unit, source, date, estimate, document, calculation method, and unresolved input that could change the comparison. That record lets the reader turn a broad housing question into a smaller set of facts, tradeoffs, and next actions without asking this image to answer a different stage of the decision.
What still must be verified
The explanation around “Mortgage Rates By Decade” must remain inside the evidence available for this page. The image provides education, not a loan decision, property valuation, legal conclusion, tax result, inspection finding, insurance commitment, or guarantee of future market performance. The “Mortgage Rates By Decade — Documentation Calculations and Planning Details” visual supports a better-informed conversation, while the actual decision remains tied to current evidence and the people authorized to interpret it. On “What Happens When Rates Drop?,” that safeguard applies specifically to the evidence and calculation layer role assigned to “Mortgage Rates By Decade.”
Mortgage Rates Impact — Tradeoffs Limitations and Next Steps Image Overview
+ −What this image communicates
The visible message in “Mortgage Rates Impact — Tradeoffs Limitations and Next Steps” directs attention to homebuying decision framework on “What Happens When Rates Drop.” The image functions as a tradeoff and limitation view: it should put the benefit beside the cost, condition, risk, or opportunity sacrificed so the decision is not reduced to one attractive feature. That gives the reader a specific reason to slow down before acting. The visual presents “Mortgage Rates Impact” as a sequence with dependencies. Its order matters: one confirmed input creates the next task, and an unresolved item can stop the file, listing, or purchase from advancing. By turning the process into visible stages, the graphic lets a reader identify the current position, the next handoff, and the deadline or evidence that controls progress.
Why it belongs on this page
Its six images cover the immediate mechanism, a one-percentage-point illustration, the unusual 2–3% era, decade-level rate history, payment impact, and the need for an individual strategy. The tradeoff and limitation view role of “Mortgage Rates Impact” is the reason this image belongs at this point in “What Happens When Rates Drop?.”
How a reader can use it
Use “Mortgage Rates Impact” for its stated tradeoff and limitation view job on “What Happens When Rates Drop.” Compare the strongest alternative, the downside if an assumption fails, and the fallback available if timing or eligibility changes. The working notes for this panel should record the benefit gained, the cost accepted, the condition attached to it, the strongest alternative, the failure point, and the available fallback. That record lets the reader turn a broad housing question into a smaller set of facts, tradeoffs, and next actions without asking this image to answer a different stage of the decision.
What still must be verified
Keep the visual in its proper role. The image provides education, not a loan decision, property valuation, legal conclusion, tax result, inspection finding, insurance commitment, or guarantee of future market performance. If a later disclosure, source update, appraisal, inspection, title item, program rule, or contract term conflicts with “Mortgage Rates Impact — Tradeoffs Limitations and Next Steps,” the current controlling evidence takes priority. On “What Happens When Rates Drop?,” that safeguard applies specifically to the tradeoff and limitation view role assigned to “Mortgage Rates Impact.”
The Right Strategy — Local Evidence and Practical Application Image Overview
+ −What this image communicates
On “What Happens When Rates Drop,” the “The Right Strategy — Local Evidence and Practical Application” visual isolates one decision from a larger housing conversation. As a practical application, it is meant to connect the strategy to a real property, market, household, or professional conversation without overstating what the example proves. The subject belongs to homebuying decision framework, where the useful question is how goals, payment comfort, cash needs, property fit, timing, risk, and professional responsibilities come together. The image makes “The Right Strategy” the dominant visual message and gives the reader a defined entry point into the page's argument. The wording identifies what deserves attention first; the surrounding design establishes whether the reader is looking at a claim, a choice, a sequence, or a practical resource. That distinction determines what evidence should be gathered before the message is applied.
Why it belongs on this page
The page is useful when readers compare total cost and market response rather than waiting for one headline rate. The practical application role of “The Right Strategy” is the reason this image belongs at this point in “What Happens When Rates Drop?.”
How a reader can use it
Use “The Right Strategy” for its stated practical application job on “What Happens When Rates Drop.” Translate the principle into address-level and transaction-level questions, then verify them with the responsible source or professional. The working notes for this panel should record the exact property or household facts, current local evidence, source date, responsible professional, and any condition that prevents the example from transferring unchanged. That record lets the reader turn a broad housing question into a smaller set of facts, tradeoffs, and next actions without asking this image to answer a different stage of the decision.
What still must be verified
The boundary is important. The image provides education, not a loan decision, property valuation, legal conclusion, tax result, inspection finding, insurance commitment, or guarantee of future market performance. The “The Right Strategy — Local Evidence and Practical Application” image can improve preparation and questions, but it cannot replace the records, disclosures, findings, approvals, or agreements issued for the actual borrower, property, and transaction. On “What Happens When Rates Drop?,” that safeguard applies specifically to the practical application role assigned to “The Right Strategy.”