Why Do Home Prices Keep Rising?
Higher Rates Slowed The Market. But They Never Solved The Housing Shortage.
The Missing Piece Most People Aren’t Seeing
Most people assume higher mortgage rates automatically cause home prices to fall.
But housing markets are driven by supply and demand. And right now, in many parts of the country, the supply side of the equation is still extremely constrained.
That’s one of the biggest reasons home prices have remained far more resilient than many people expected.
During the housing crash, inventory flooded the market.
Today, inventory remains well below historically balanced levels.
And when more buyers compete for fewer available homes, prices naturally face upward pressure.
Not Enough Homes For Sale — Core Strategy and Decision Context
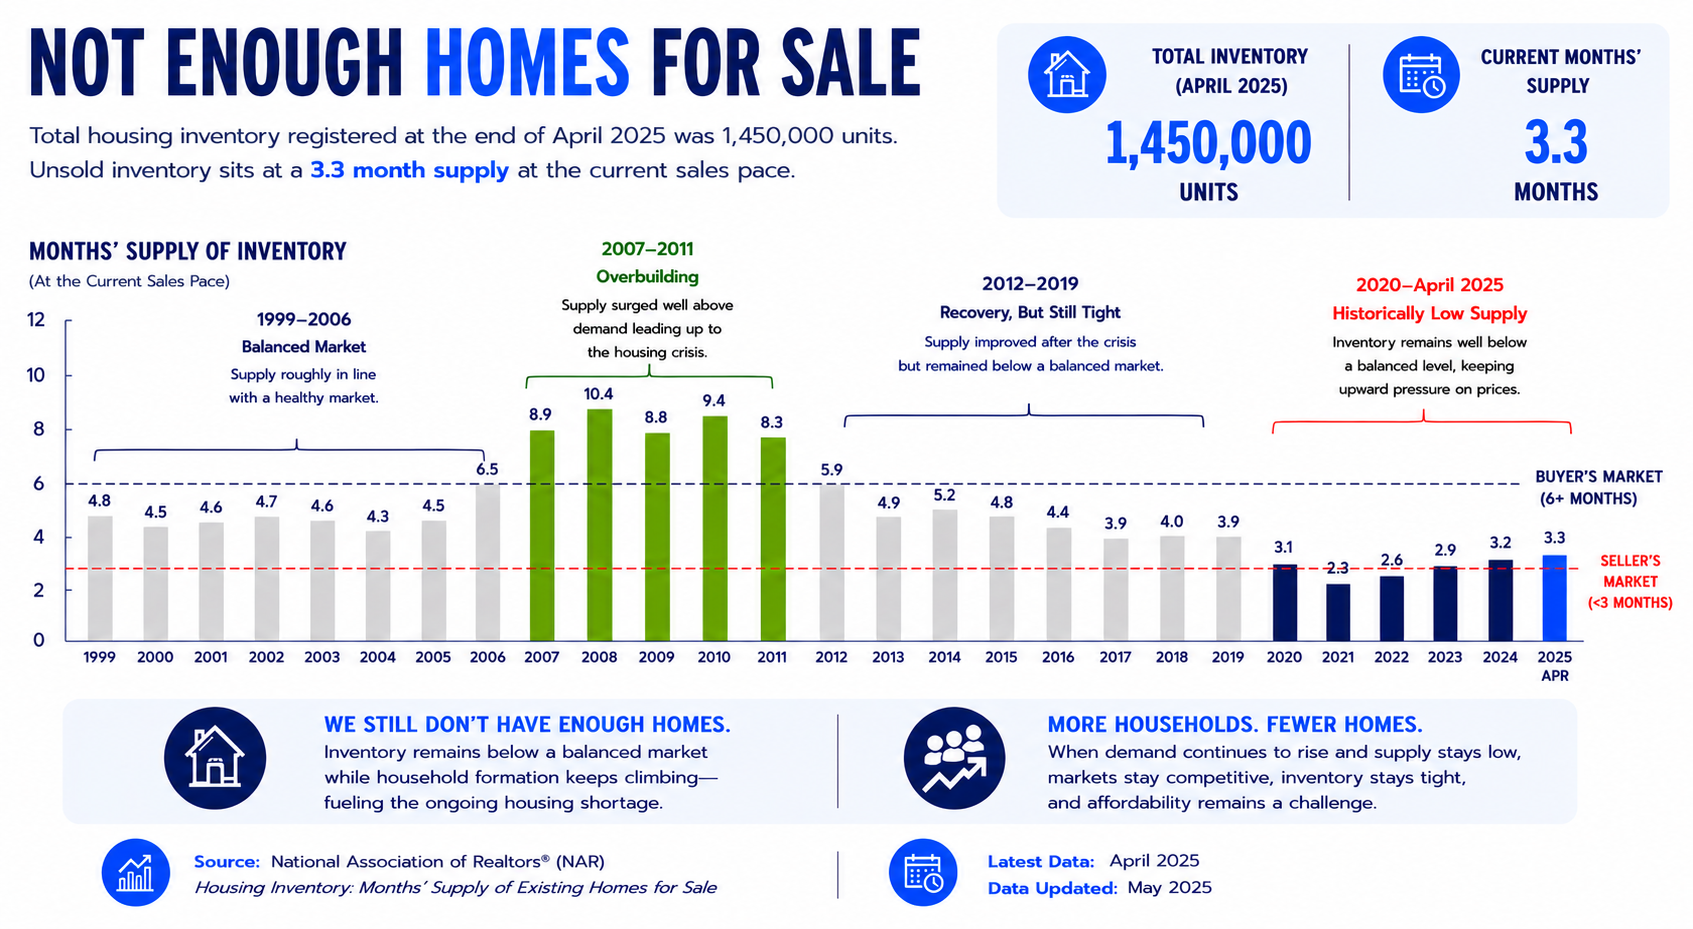
Not Enough Homes For Sale — Core Strategy and Decision Context
More Buyers. Fewer Homes.
That’s The Core Of The Supply Problem.
When demand continues to grow while supply stays limited, prices naturally become more competitive.
That does not mean prices rise forever.
And it doesn’t mean every market behaves the same.
But it does help explain why national home prices have remained far more resilient than many expected, even in a higher-rate environment.
Months Supply Of Existing Homes For Sale
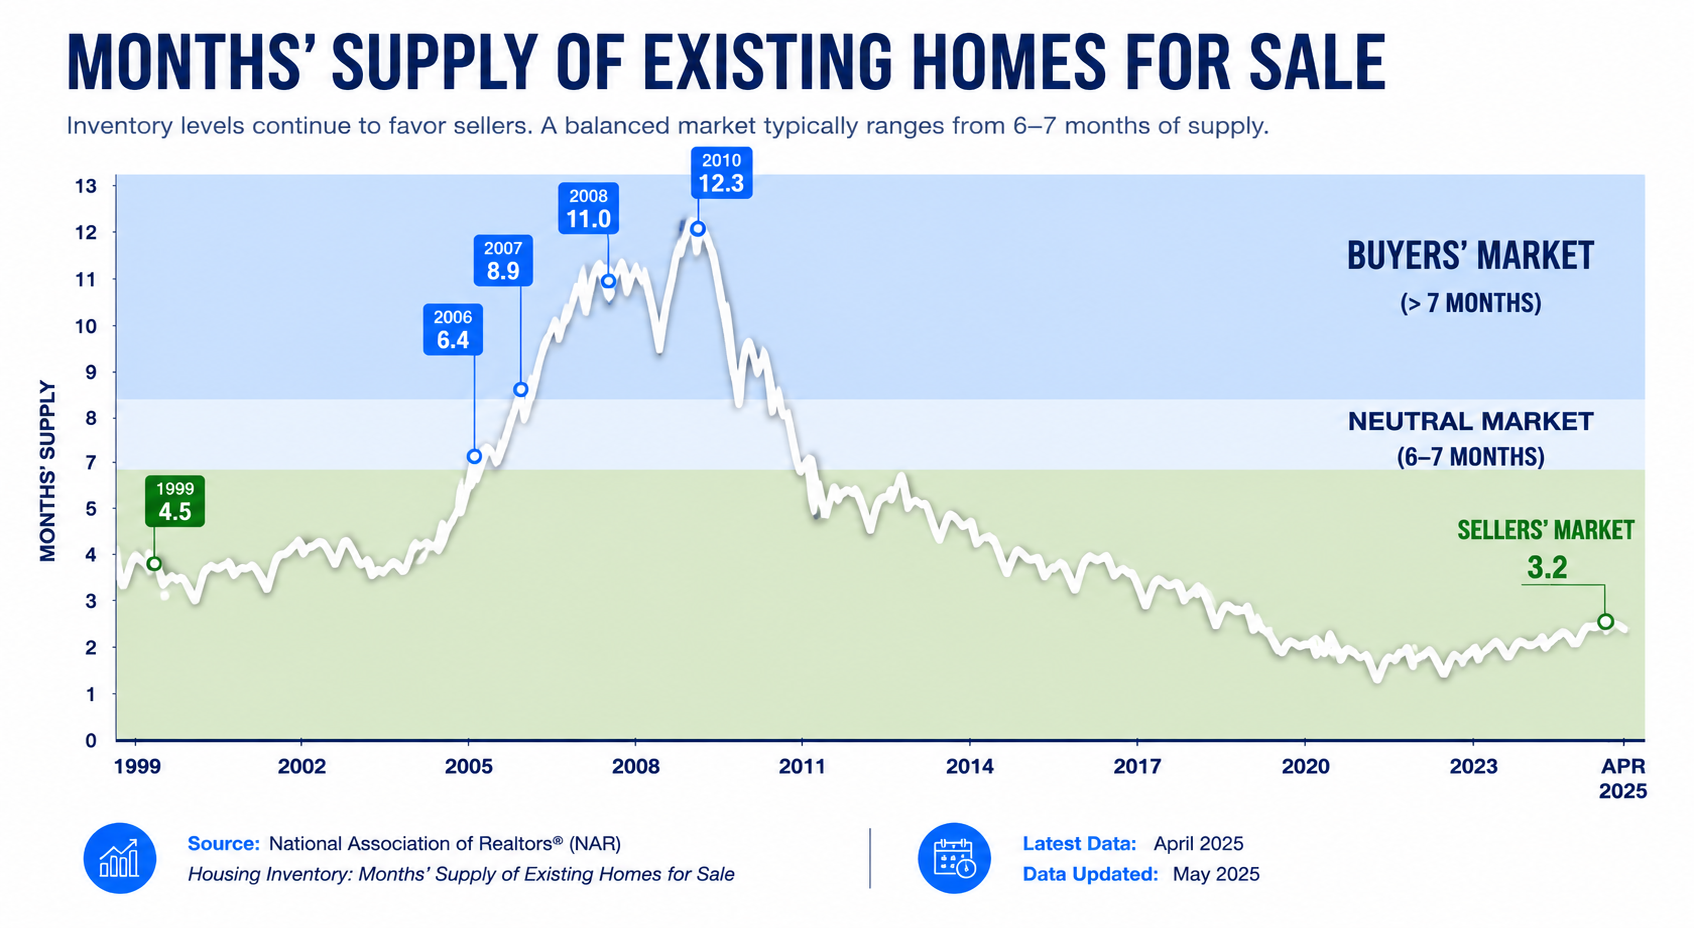
Months Supply Of Existing Homes For Sale
Higher Rates DID Slow The Market
This is important.
Higher mortgage rates absolutely impacted affordability.
Sales slowed.
Buyer activity cooled.
And many markets became less competitive than they were during the peak frenzy years.
But slower demand is very different from a massive oversupply of homes.
And in many areas, the inventory shortage still exists today.
That’s one of the biggest reasons today’s housing market behaves very differently from the market leading into the 2008 housing collapse.
National Home Prices Slowed. But They Didn’t Collapse.
Many people expected higher mortgage rates to trigger a large nationwide housing crash.
Instead, in many parts of the country, prices slowed but remained relatively resilient as inventory stayed constrained.
Home Price Growth Accelerates — Who This Resource Helps and Why
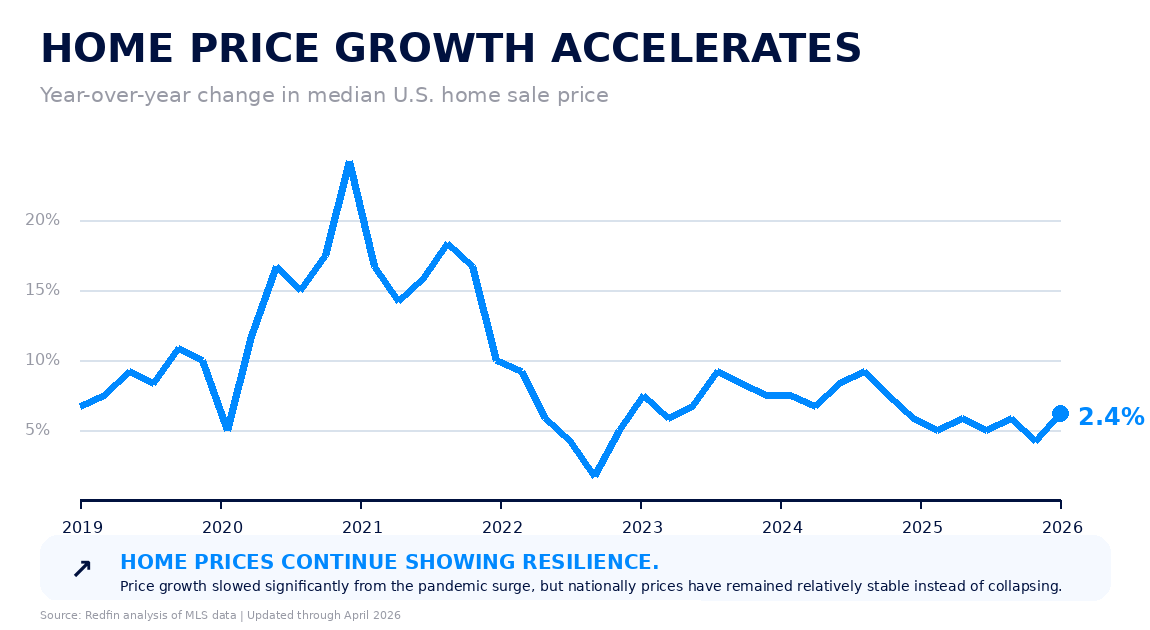
Home Price Growth Accelerates — Who This Resource Helps and Why
What Are Major Housing Analysts Forecasting?
While no one can perfectly predict the future housing market, many major institutions continue to forecast modest national home price growth.
But many major housing institutions currently expect moderate national home price growth moving forward rather than a large nationwide housing collapse.
That does not guarantee what will happen in every city or neighborhood.
But it does highlight how many analysts continue to view the housing shortage as one of the most important long-term market forces influencing home prices.
Expect Moderate Home Price Growth in 2026
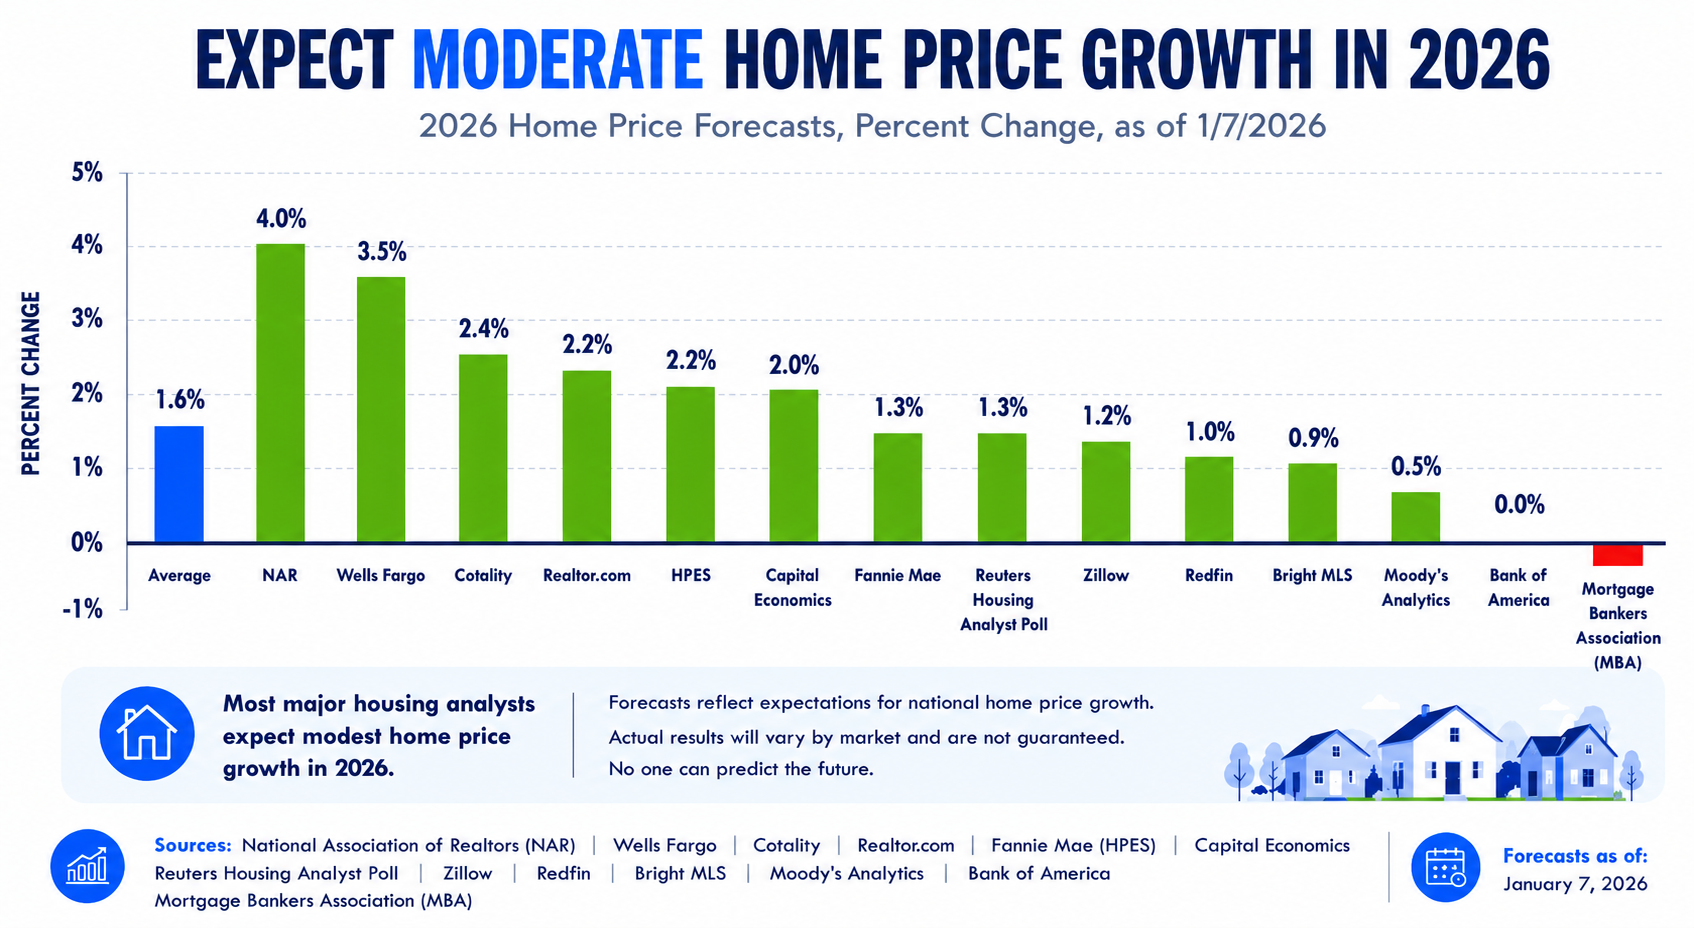
Expect Moderate Home Price Growth in 2026
Are Home Prices Already Tracking Higher?
The market may be closer to analyst forecasts than many buyers realize.
While most headlines focus on mortgage rates, home values continue to rise nationwide. Based on Case-Shiller Home Price Index data through March 2026, home prices are currently tracking at an annualized pace that aligns with, and in some cases exceeds, many major housing forecasts for 2026.
What This Means For You
Home prices are appreciating more slowly than the long-term historical average, but they continue to move higher nationally despite elevated mortgage rates. Current Case-Shiller data suggests the market is already tracking near the appreciation levels forecasted by major housing analysts for 2026.
Annualized pace calculated using average monthly Case-Shiller appreciation through March 2026. Actual year-end appreciation may be higher or lower.
Home Prices Are Still Rising Despite Higher Rates - Updated Sept. 17, 2026
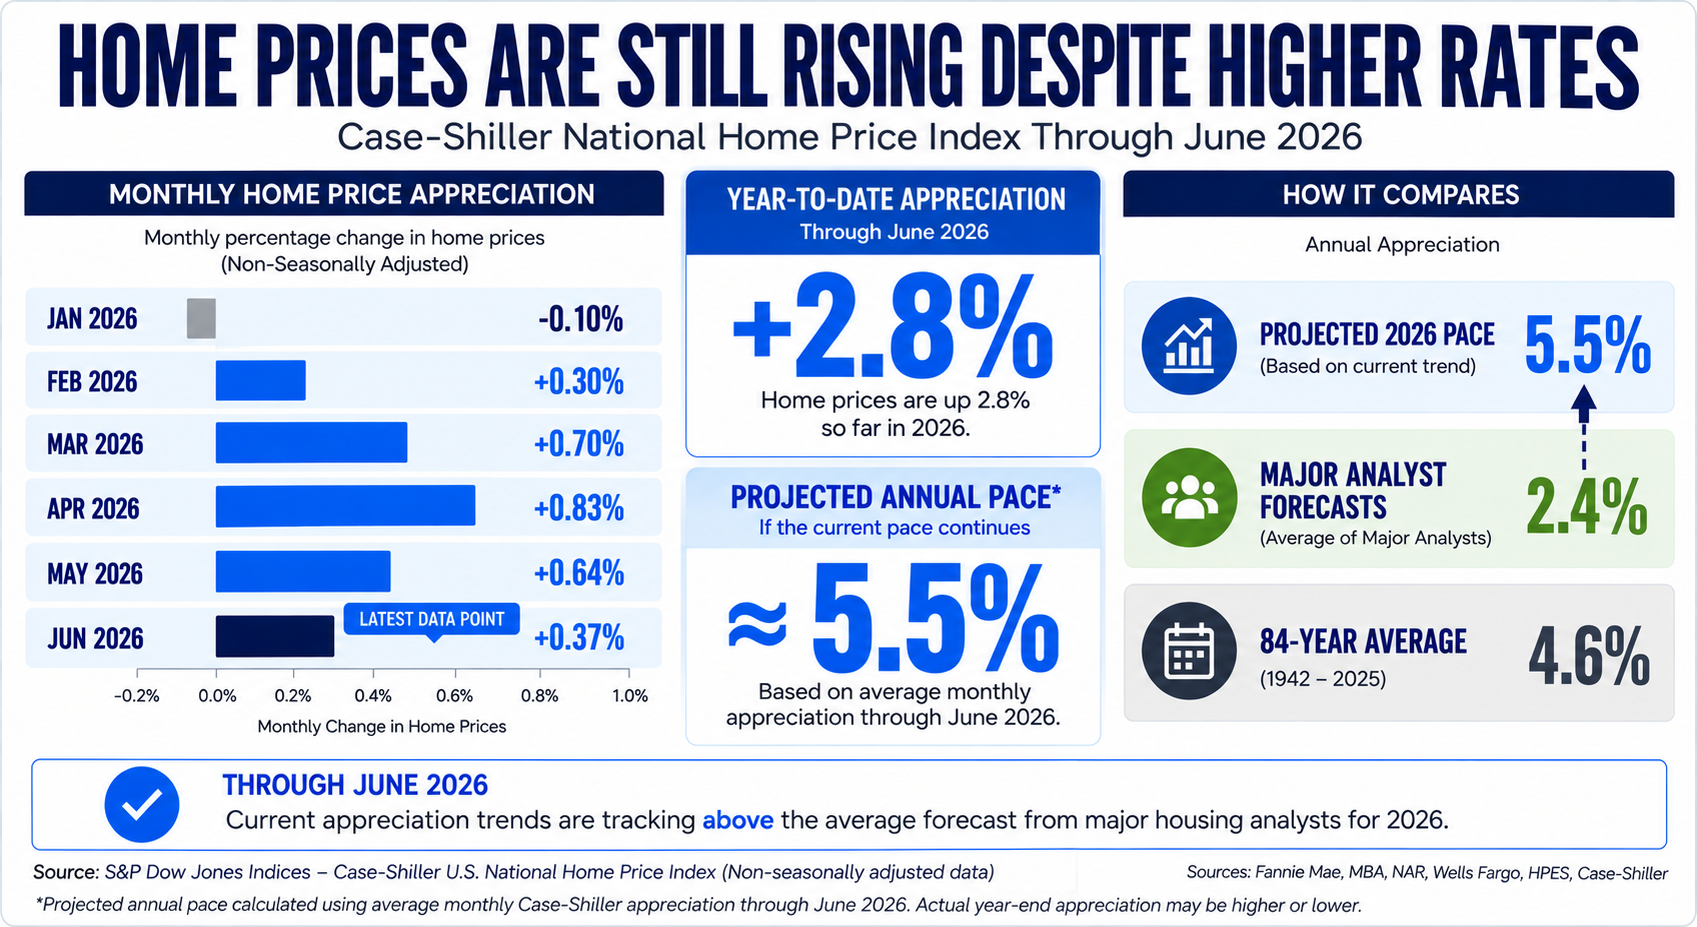
Home Prices Are Still Rising Despite Higher Rates - Updated Sept. 17, 2026
Real Estate Is Local
Every housing market is different.
Some markets may outperform. Some may flatten. Some may experience periods of correction.
Housing markets are influenced by:
➡️ Inventory levels
➡️ Affordability
➡️ Local job growth
➡️ Migration patterns
➡️ New construction
➡️ Local economic conditions
The purpose of understanding these trends is not to predict the future perfectly. It’s to better understand the market forces influencing today’s housing market.
Every Buyer’s Situation Is Different
The housing market is complex.
And unfortunately, many buyers today are hearing conflicting opinions, emotional headlines, social media hot takes, and one-size-fits-all advice without ever being shown the full picture.
That’s why this presentation series was created: to help buyers better understand the bigger picture of housing affordability, competition, leverage, market psychology, mortgage rates, and long-term financial strategy, and how these factors often work together rather than focusing on only one piece of the puzzle.
Click the links below to continue exploring the Housing Market Series:
➡️ The Supply Problem Most People Don’t Realize Exists
➡️ What History Shows Us About Home Values
➡️ What Happens When Rates Drop?
➡️ Why Waiting Could Create More Competition
➡️ Why Today’s Buyers Still Have Opportunity
➡️ Today’s Buyers Have More Leverage Than They Think
If you’d like help understanding how these market dynamics may impact your specific situation, we’re happy to walk through the numbers with you and help you evaluate your options clearly and strategically.
➡️ Schedule Your Strategy Call Here
Best regards,
Michael Thayer, CMPS, CMA
NMLS #173264
Planet Home Lending, NMLS #17022
Explore Buyer & Seller Resources & Next Steps
+ −Market Timing vs. Market Strategy: When Is the Right Time to Buy... And More Importantly, Why?
Calculators & Loan Programs Questions Answered: Mortgage Programs & Financing Calculator
Smart Financing Strategies to Lower Your Monthly Mortgage Payment: Smart Mortgage Strategies & Financing Hacks
Homebuying Roadmap: Your Mortgage GPS
Moving To Middle Tennessee: Moving To Middle Tennessee Resource Center
Search Open Houses: View All Middle Tennessee Open Houses
Main Resource Hub: Buyers, Sellers, Realtors, and Builders Resources and Strategies
Additional Information & Reference Guides
+ −Welcome Video Transcript
+ −Video Transcript
00:00
One of the biggest questions people are asking right now is, if mortgage rates are higher, why haven't home prices crashed?
00:07
And the answer? It's much simpler than most people realize. We still don't have enough homes!
00:14
My name's Michael Thayer. I'm a mortgage advisor based in Nashville, Tennessee, serving clients nationwide. And for years, the housing market has been faced with a major supply problem.
00:24
Household formations have continued growing, but home construction slowed dramatically after the 2008 housing crash, and never caught back up.
00:33
That means more competing buyers for fewer homes, tighter inventory, and continued pressure on the home prices in many markets.
00:42
And while higher mortgage rates have slowed demand temporarily.
00:46
Limited supply continues to support home values over time.
00:51
And because home prices are driven by more than just interest rates, they are driven by supply and demand.
00:58
That's exactly what this page is designed to help you understand.
01:01
We walk you through why home prices have remained more resilient than many expected.
01:06
How inventory shortages continue to impact affordability.
01:11
What happened after the housing crash?
01:13
And why today's housing market looks completely different than 2008.
01:19
Because understanding why prices keep rising?
01:22
Starts with understanding one important reality.
01:26
There still aren't enough homes for the number of people who want to buy them.
01:31
So take a few minutes, explore the information below. And if you'd like help understanding how today's market conditions may impact your buying, selling, or financial strategies, schedule a strategy call. Let's walk through what might make more sense for you and your goals. Talk to you soon.
Not Enough Homes For Sale — Core Strategy and Decision Context Image Overview
+ −What this image communicates
A reader encountering “Not Enough Homes For Sale — Core Strategy and Decision Context” should immediately recognize the housing-market evidence question inside “Why Do Home Prices Keep Rising.” The visual's role is central strategy, so it must state the main tension clearly and show which decision should be made before secondary details distract from it rather than merely repeat the headline. The visual centers “Not Enough Homes For Sale” on a specific housing or listing decision. It connects the visible promise to the property, the people involved, and the transaction sequence instead of leaving the message as abstract marketing. A useful reading separates what can be illustrated now from what still depends on the home's condition, the negotiated terms, verified financing, and current market response.
Why it belongs on this page
The home-price page connects limited inventory with months of supply, observed price growth, a 2026 moderation outlook, and the persistence of appreciation despite higher mortgage rates. The central strategy role of “Not Enough Homes For Sale” is the reason this image belongs at this point in “Why Do Home Prices Keep Rising?.”
How a reader can use it
Use “Not Enough Homes For Sale” for its stated central strategy job on “Why Do Home Prices Keep Rising.” Name the desired outcome, identify the constraint that could block it, and decide which evidence would change the answer. The working notes for this panel should record the desired result, the assumption carrying the most risk, the fact that would disprove it, and the decision that must be made first. That record lets the reader use market context to improve timing and negotiation questions without converting a broad statistic into a property-level prediction without asking this image to answer a different stage of the decision.
What still must be verified
The boundary is important. National or regional data cannot establish a specific home's value, condition, future appreciation, market time, offer activity, or the result of waiting. The “Not Enough Homes For Sale — Core Strategy and Decision Context” image can improve preparation and questions, but it cannot replace the records, disclosures, findings, approvals, or agreements issued for the actual borrower, property, and transaction. On “Why Do Home Prices Keep Rising?,” that safeguard applies specifically to the central strategy role assigned to “Not Enough Homes For Sale.”
Months Supply Of Existing Homes For Sale Image Overview
+ −What this image communicates
“Months Supply Of Existing Homes For Sale” establishes the visual entry point for this part of “Why Do Home Prices Keep Rising.” Its primary visual message framing helps the reader understand how to make one topic recognizable at a glance and give the reader a clear entry point into the deeper explanation on the page. The decision underneath the graphic is what the chart or comparison says about supply, demand, prices, rates, equity, leverage, or competition at the geography and period actually measured. The graphic foregrounds the measured or numbered claim in “Months Supply Of Existing Homes For Sale” so the reader can see the scale, sequence, or direction being discussed. Numbers in this format are meaningful only with their date range, geography, unit, source, and comparison point. The visual's job is to make the pattern understandable while keeping the underlying measurement visible as a separate verification task.
Why it belongs on this page
Each image contributes a different time scale or mechanism. The primary visual message role of “Months Supply Of Existing Homes For Sale” is the reason this image belongs at this point in “Why Do Home Prices Keep Rising?.”
The exact story carried by this graphic
The months-supply panel explains the inventory mechanism behind price pressure. Months of supply estimates how long the available homes could last at the current sales pace; a low figure usually gives buyers fewer substitutes and sellers more leverage, while a rising figure can ease competition. The reader should check the chart's geography, reporting period, calculation method, and property segment before using it. A national measure can explain direction, but it cannot describe the active alternatives surrounding one Middle Tennessee home.
How a reader can use it
Use “Months Supply Of Existing Homes For Sale” for its stated primary visual message job on “Why Do Home Prices Keep Rising.” Identify the claim, chart, comparison, process, property feature, or strategy shown and connect it to the exact decision the page addresses. The working notes for this panel should record the literal claim or comparison shown, the page fact it supports, the source behind that fact, and the decision the reader should make next. That record lets the reader use market context to improve timing and negotiation questions without converting a broad statistic into a property-level prediction without asking this image to answer a different stage of the decision.
What still must be verified
National or regional data cannot establish a specific home's value, condition, future appreciation, market time, offer activity, or the result of waiting. “Months Supply Of Existing Homes For Sale” should therefore be treated as a primary visual message, not as transaction evidence by itself. Current documents, responsible sources, and the professionals accountable for the relevant decision must control when they differ from the illustration. On “Why Do Home Prices Keep Rising?,” that safeguard applies specifically to the primary visual message role assigned to “Months Supply Of Existing Homes For Sale.”
Home Price Growth Accelerates — Who This Resource Helps and Why Image Overview
+ −What this image communicates
“Home Price Growth Accelerates — Who This Resource Helps and Why” is not a decorative break in “Why Do Home Prices Keep Rising.” It is the page's reader and use-case map, designed to explain who benefits, what problem each person is trying to solve, and why the same information may lead to different questions. That framing matters because the reader is evaluating what the chart or comparison says about supply, demand, prices, rates, equity, leverage, or competition at the geography and period actually measured. The graphic foregrounds the measured or numbered claim in “Home Price Growth Accelerates” so the reader can see the scale, sequence, or direction being discussed. Numbers in this format are meaningful only with their date range, geography, unit, source, and comparison point. The visual's job is to make the pattern understandable while keeping the underlying measurement visible as a separate verification task.
Why it belongs on this page
The value is understanding how supply and demand can support prices without assuming every market, neighborhood, property type, or home follows the same path. The reader and use-case map role of “Home Price Growth Accelerates” is the reason this image belongs at this point in “Why Do Home Prices Keep Rising?.”
How a reader can use it
Use “Home Price Growth Accelerates” for its stated reader and use-case map job on “Why Do Home Prices Keep Rising.” Match the graphic to the reader's role, current stage, pressure, and decision authority before applying its guidance. The working notes for this panel should record who the guidance is for, the reader's current stage, the decision they control, the problem they need solved, and when a specialist must take over. That record lets the reader use market context to improve timing and negotiation questions without converting a broad statistic into a property-level prediction without asking this image to answer a different stage of the decision.
What still must be verified
“Home Price Growth Accelerates” organizes the reader and use-case map part of the decision; it does not settle the rest. National or regional data cannot establish a specific home's value, condition, future appreciation, market time, offer activity, or the result of waiting. The responsible next step after “Home Price Growth Accelerates — Who This Resource Helps and Why” is to obtain the current document or finding that governs the issue and reconcile any difference before proceeding. On “Why Do Home Prices Keep Rising?,” that safeguard applies specifically to the reader and use-case map role assigned to “Home Price Growth Accelerates.”
Expect Moderate Home Price Growth in 2026 Image Overview
+ −What this image communicates
“Expect Moderate Home Price Growth in 2026” establishes the visual entry point for this part of “Why Do Home Prices Keep Rising.” Its primary visual message framing helps the reader understand how to make one topic recognizable at a glance and give the reader a clear entry point into the deeper explanation on the page. The decision underneath the graphic is what the chart or comparison says about supply, demand, prices, rates, equity, leverage, or competition at the geography and period actually measured. The graphic foregrounds the measured or numbered claim in “Expect Moderate Home Price Growth in 2026” so the reader can see the scale, sequence, or direction being discussed. Numbers in this format are meaningful only with their date range, geography, unit, source, and comparison point. The visual's job is to make the pattern understandable while keeping the underlying measurement visible as a separate verification task.
Why it belongs on this page
The home-price page connects limited inventory with months of supply, observed price growth, a 2026 moderation outlook, and the persistence of appreciation despite higher mortgage rates. The primary visual message role of “Expect Moderate Home Price Growth in 2026” is the reason this image belongs at this point in “Why Do Home Prices Keep Rising?.”
The exact story carried by this graphic
The 2026 forecast panel shifts from current inventory to an expected outcome: moderate price growth rather than the rapid gains of an unusually constrained period or the sharp decline implied by a crash narrative. Its value is the middle ground it makes visible. The forecast should be read with its publication date, source, geography, and assumptions about rates, employment, household formation, construction, and resale supply. It is a planning range, not a promised appreciation rate for a particular home.
How a reader can use it
Use “Expect Moderate Home Price Growth in 2026” for its stated primary visual message job on “Why Do Home Prices Keep Rising.” Identify the claim, chart, comparison, process, property feature, or strategy shown and connect it to the exact decision the page addresses. The working notes for this panel should record the literal claim or comparison shown, the page fact it supports, the source behind that fact, and the decision the reader should make next. That record lets the reader use market context to improve timing and negotiation questions without converting a broad statistic into a property-level prediction without asking this image to answer a different stage of the decision.
What still must be verified
The final safeguard is verification. National or regional data cannot establish a specific home's value, condition, future appreciation, market time, offer activity, or the result of waiting. A reader should leave “Expect Moderate Home Price Growth in 2026” knowing what to ask and what to gather—not believing that a graphic has already supplied an approval, valuation, legal conclusion, or guaranteed outcome. On “Why Do Home Prices Keep Rising?,” that safeguard applies specifically to the primary visual message role assigned to “Expect Moderate Home Price Growth in 2026.”
Home Prices Are Still Rising Despite Higher Rates Image Overview
+ −What this image communicates
“Home Prices Are Still Rising Despite Higher Rates” is not a decorative break in “Why Do Home Prices Keep Rising.” It is the page's primary visual message, designed to make one topic recognizable at a glance and give the reader a clear entry point into the deeper explanation on the page. That framing matters because the reader is evaluating what the chart or comparison says about supply, demand, prices, rates, equity, leverage, or competition at the geography and period actually measured. The visual centers “Home Prices Are Still Rising Despite Higher Rates” on a specific housing or listing decision. It connects the visible promise to the property, the people involved, and the transaction sequence instead of leaving the message as abstract marketing. A useful reading separates what can be illustrated now from what still depends on the home's condition, the negotiated terms, verified financing, and current market response.
Why it belongs on this page
Each image contributes a different time scale or mechanism. The primary visual message role of “Home Prices Are Still Rising Despite Higher Rates” is the reason this image belongs at this point in “Why Do Home Prices Keep Rising?.”
How a reader can use it
Use “Home Prices Are Still Rising Despite Higher Rates” for its stated primary visual message job on “Why Do Home Prices Keep Rising.” Identify the claim, chart, comparison, process, property feature, or strategy shown and connect it to the exact decision the page addresses. The working notes for this panel should record the literal claim or comparison shown, the page fact it supports, the source behind that fact, and the decision the reader should make next. That record lets the reader use market context to improve timing and negotiation questions without converting a broad statistic into a property-level prediction without asking this image to answer a different stage of the decision.
What still must be verified
The image is valuable because it frames the right issue, not because it proves the answer. National or regional data cannot establish a specific home's value, condition, future appreciation, market time, offer activity, or the result of waiting. “Home Prices Are Still Rising Despite Higher Rates” remains educational until the current borrower, property, market, and transaction evidence supports a specific conclusion. On “Why Do Home Prices Keep Rising?,” that safeguard applies specifically to the primary visual message role assigned to “Home Prices Are Still Rising Despite Higher Rates.”